
semiotic
A data visualization framework combining React & D3
OTHER License
Bot releases are visible (Hide)
Published by emeeks over 6 years ago
#FIXES
- Hopefully an update to a newer version of
json2csvwill get rid of an occasional bug where installing the package wouldn't work (without complaint or apparent cause) - SVG JSX titles are placed within a centered
<g>element so that they can be used with responsive frames - Axes create a bit more padding for labels when margins are not defined and the axis has a label
- Annotations that are being placed via
marginaliaannotation mode will not overwrite any sentorientationoralignsettings so those settings will respond as expected according toreact-annotation.
#FEATURES
-
titleproperties in frames now accept an object (along with already accepting a string or SVG JSX) of structure:{ title: yourStringOrJSXTitle, [orient: "left"|"right"|"bottom"|"top" ]}that will place a title in those areas (defaulting to top). If there are no margin settings, the corresponding margin will be increased by 40px. String titles on the left or right are rotated in the same manner as Axis Labels
Published by emeeks over 6 years ago
Features
- Tooltips in keyboard navigation

- Better accessibility (axis ARIA labels, formatting of line labels in line charts)
- Arrays of arrays can be sent to
linesorareasin<XYFrame>and will be rendered without any kind oflineDataAccessorsettings
Fixes
- Check for
focuson SVG elements - Correct title labeling for visualization ARIA label
Published by emeeks over 6 years ago
Fixes
- Replaces
tabindexthroughout withtabIndexwhich should make accessibility work fine with React 15.x and 16.1+.
Features
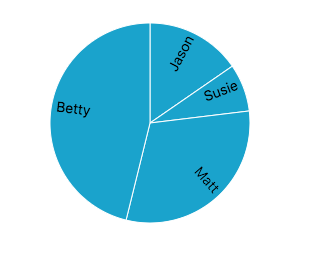
- oLabel now honors several
orientandpaddingsettings in radial mode (pie charts). You can sendoLabel={{ label: "true", orient: "stem" }}and get:

"stem" orient also honors negative padding if you want the labels inside the slices, sooLabel={{ label: "true", orient: "stem", padding: -5 }}gives you:
It also honors "edge" (which is the new default) sooLabel={true}will give you:

oLabel={{ label: "true", orient: "edge", padding: -10 }}insets the labels:

The old default (arc centroid) can be achieved withorient: "center"but why would you with these cool options? - legend honors an
orientation="horizontal"to create simple horizontal legends.
Published by emeeks over 6 years ago
Features
- Accessibility (Only Available in React 16+). Frames now have tabindex on the viz groups (pieces and summaries in OrdinalFrame, nodes and edges in NetworkFrame, lines and areas and points in XYFrame) so you can tab to the viz group and then hit enter and arrow key through the individual items, which are described with aria labels and some rudimentary descriptions. Please let me know how I can improve it.

- Array position is available in tickFormat for axis elements as the second argument, so
(d,i) => iwould work for tickFormat.
Published by emeeks over 6 years ago
Fixes
- This should fix the problem with the unpkg dist not working in codepens and elsewhere... hopefully.
- ResponsiveFrame was taking a
styleprop and passing it down to its child frame, which would conflict withOrdinalFrame's style property (which applies to pieces). Something more elegant on this front needs to happen to resolve this. - highlight annotation types wouldn't recognize ids if those ids were the number 0 because of truthy testing, now it explicitly looks for undefined values
- highlight annotations weren't working with points because points would have no y value because the id accessor would think you always wanted them positioned along a line, that's no longer the case
Published by emeeks over 6 years ago
This cleans up a lot of little bugs that cropped up in the last couple minor releases.
Fixes
- tabIndex of the resize object in responsive frames is set to "-1"
- binValue is honored correctly for histogram summaryTypes
- areas generate showLinePoints points correctly
- highlight annotations were eating react-annotation function type annotations
- Some of the examples had stale CSS settings
- marginalia annotation handling would fail if you didn't have any axes at all
- download field mapping for downloads wasn't working right in a couple cases (OrdinalFrame and XY lines)
- highlight annotation was setting the curve of the drawn highlight in such a way that if you didn't have an interpolator defined it would cause an error
Published by emeeks over 6 years ago
Fixes
-
pieceHoverAnnotationfor bars, clusterbars and timelines wasn't in the right place
Published by emeeks over 6 years ago
Features
-
highlight-annotationmakes it easy to highlight regions on hover and do nice cross-highlighting. https://emeeks.github.io/semiotic/#/semiotic/creatingpcrosshighlight - Bars, timelines and cluster bars now have piece hover based on the shape of the pieces and no longer on some mad scheme to use voronoi for everything
Fixes
- Sankey edges weren't being drawn correctly
-
linepercentandstackedpercentand other aggregate lines weren't rendering shown points properly - Download fields weren't being honored but are now only honored when downloads are set to "points" mode
- Difference lines were not correctly rendering the difference line overlays
Published by emeeks over 6 years ago
Fixes
- The recent changes allowing the brush to redraw itself caused some issues for the XY brush which when fixed revealed some other brush issues. It seems like brushes are in much better shape now.
-
nodeRenderKeyis honored inNetworkFrameto specify more complex render keys for nodes
Features
- New "Creating Line Chart" example that shows how to make a vertical brush and tie it to a chart.
Features
- Added
customAreaMarkto XYFrame, which is sent({d, projectedCoordinates, xScale, yScale, bounds})you can return just thedto be passed to a path element or whatever JSX SVG you want. the bounds object sent includes bounding box and a "center" which is the pole of inaccessibility (for labels) - Parent div/span of frames will have a class corresponding to the frame (
xyframe,ordinalframe,networkframe)
Fixes
- Brush will reinitialize with a new extent (thanks @susielu)
- unpkg dist name corrected (thanks @puria)
- Voronoi points are constrained to those on the canvas, so if you use fixed extents and push points off the canvas, the hover regions will ignore them
- Added ESlint config file (thanks @netbek) and linted the heck out of things
Tests
- Actually wrote some tests. Coverage is still... disappointing
Published by emeeks over 6 years ago
Fixes
- mattes were being drawn above axis labels should be drawn below them
- extents returned from the new extent onChange should have always been calculated extents and ignored the user defined values sent to extent
Published by emeeks over 6 years ago
Fixes
- customMark in ORFrame wasn't being passed the datapoint data
- oExtent wasn't taking a set extent
- frameKey can be set as an XYFrame prop and will not be set unless matte is enabled, this was causing some issues with Wordpress.
Published by emeeks over 6 years ago
Fixes
- Fix for
definedbehavior inXYFrame
Published by emeeks over 6 years ago
Features
- Added a "linepercent" lineType to
XYFramethat does the same thing "stackedpercent" does but for lines - Added
percentas a decoration to the data points when hovering and added a defaultpercentto the default tooltip content when you're hovering on stackedpercent and linepercent
Fixes
- "stackedpercent" was crashing hoverAnnotation
Published by emeeks over 6 years ago
Features
- oExtent, rExtent, yExtent & xExtent will not also take objects with format
{ extent, onChange }as well as arrays. IfonChangeis specified, this will fire a function whenever the calculated extent changes.
Fixes
- Hover axes were rendering with position errors
-
canvaselement was too large
Published by emeeks over 6 years ago
Fixes
- Canvas rendering no longer hard-crops the edges
- Difference lines were rendering strangely
- Some of the docs needed their settings reset
- Remove Lodash and use native ES2015 functions
- Remove d3-sankey and use d3-sankey-circular for non-circular sankeys
- Make sure everything in devDependencies and dependencies in
package.jsonmakes sense
Docs
- Add some inline videos for docs where I've done livestreams on those subjects
Published by emeeks over 6 years ago
Fixes
- Legends were not taking into account margin and being drawn overlapping the frame
Published by emeeks over 6 years ago
Features
- Updated to
semiotic-mark0.1.2 which supports gradients for painty rendermode - Add a
pieceIDAccessorproperty toOrdinalFramein order to support relative annotation, so you could annotate a piece rather than a value.
Published by emeeks over 6 years ago
Fixes
- SVG and HTML annotation layers were out of order, HTML should be on top
- Vertical and Horizontal points along the line annotations weren't being calculated correctly
Published by emeeks over 6 years ago
#Fixes
- "tp" in default edge tooltip content instead of "to"
-
margin.leftwas being passed wheremargin.topshould have been passed (thanks @jeff3dx) for the - Sankey edge tooltips are centered on the edge rather than the top of the edge