
semiotic
A data visualization framework combining React & D3
OTHER License
Bot releases are hidden (Show)
Published by emeeks over 6 years ago
Under the hood, there are some major changes as of this version. They should be invisible to 99% of use cases but if you're using a custom function for your type or custom drawing of shapes in tooltips or custom line marks where you generate your own lines, you'll notice that the old _xyfX attributes are replaced with less verbose versions (x, y, etc). The data is no longer mutated by frames, which was always a bad choice, margins no longer have to be applied (the canvas area where drawing is done now takes margin into account) and also the DOM isn't so cluttered with empty elements. This may require that you adjust your CSS for Tooltips but other than that if you notice any issues please file a bug.
Features
-
NetworkFrame'shoverAnnotationprop will accept"edges"to turn on hover annotation only for edges,"nodes"to turn it on only for nodes and"all"to turn on hover annotation for both nodes and edges.trueis treated as"nodes"as are any complex arrays. - Margin is now accounted for in off-setting drawn regions rather than being calculated within the individual coordinates. This should be invisible to most use cases but should be accounted for in purely custom layout and drawing types.
- DOM nodes are no longer rendered if they have no contents, so the tree should be much cleaner throughout.
- Data arrays are no longer mutated by frames
- Annotations will not honor
xandyas fixed xy coordinates forreact-annotationbecause this caused needless context. If you want a fixed x or y position in your annotations usefixedXand/orfixedY - Marginalia annotation handling now accepts a
marginOffsetthat is either a number or a function that takes(orient, axes)and defaults to 10px margin for orientation that doesn't have an axis and 50px for orientation that does have an axis - Coordinate names have more human-readable names.
_xyfX,_xyfYand the like are gone in favor ofx,y - Violin plots are drawn much better
- HTML annotations are drawn much more cleanly, but are drawn in a slightly different way, so CSS needs to be adjusted (they're being drawn from the
topinstead of thebottom). -
tooltipContentin<ORFrame>honors"pie"which passes content to the tooltip with the name of the column and the percent represented by that slice
Fixes
-
NetworkFrameproperly resizes in Spark and Responsive frames forchordandsankeylayouts - All the dumb margin code is gone. You won't notice but I do.
Published by emeeks over 6 years ago
Fixes
-
<SparkXYFrame>,<SparkOrdinalFrame>,<SparkNetworkFrame>were not exposed properly via NPM
Published by emeeks over 6 years ago
Features
-
<SparkOrdinalFrame>,<SparkNetworkFrame>and<SparkXYFrame>are all available. They have the same interface as the regular frames but the resulting data viz is generated with<span>elements instead of<div>elements so it can be dropped in a<p>. The frames get their height from theline-heightcomputed by the span they're in (so inherited from the parent or styled on the frame directly). They have some different default settings, so by default your axes will not render with baselines or ticks (though you can override any of these) and the network settings are tuned for tiny graphics. HTML annotations are not honored on Spark frames but SVG annotations are and XYFrame tries to have a reasonable default of areact-annotationwith the value of the hover.
Fixes
- By default axis baselines will only render for the first axis on that orient (so you won't get three if you have three differently styled axes on the "bottom")
- Vertical boxplots would sometimes render off with certain margin settings.
Published by emeeks over 6 years ago
Features
- The
bumplayout ofannotationSettingsnow usesd3-labeler's annealing function instead offorceSimulationso it's a bit better. It also takes the same settings asmarginaliaas far ascharWidthandlineHeight.pointSizeFunctionandlabelSizeFunctionare now properties of the layout object and not the frame. -
<Axis>labelproperty will now take JSX SVG instead of just text. - Semiotic now exports
<Mark>fromsemiotic-markto make it easy to use it in places using the static version, so like on Codepen.
Published by emeeks over 6 years ago
Features
- axes elements in DOM are now decorated with
xandyand their orientation (top,bottom,left,right) -
annotationSettingsmarginalialayout now useslabella. It honors a few new settings:padding,characterWidth&lineHeightso you can tune it to your font size.
padding The pixel size padding on the bottom and right of a note. Defaults to 2.
characterWidth The pixel width of each character. Defaults to 8.
lineHeight The pixel height of each line of a note. Defaults to 20.
Published by emeeks almost 7 years ago
Fixes
- oExtent will now accept values that aren't ordinal values in your data.
- Joy plot was rendering offset and that's fixed.
Published by emeeks almost 7 years ago
CHANGES
*ORFrame has been renamed OrdinalFrame though ORFrame will still be honored as an alias. Trying to explain what the O & R were in ORFrame was always a mess and Ordinal, while not a common word, is more comprehensible than ORFrame, especially since I went with NetworkFrame and not TTFrame or something else equally incomprehensible.
FEATURES
-
networkTypeinNetworkFramenow has ahierarchyChildrenproperty that is passed to the underlyinghierarchyfunction so you can use hierarchical JSON with different children props (thinkd3.nest)
FIXES
-
horizontal-pointsannotations now deal properly with stacked charts -
definedis honored by extent calculations so if you're using data=0 for your defined rule, then the extent is calculated based off the actual data
Published by emeeks almost 7 years ago
Some minor new features:
-
enclose-rect: All frames now honor a newenclose-rectannotation type that surrounds the array of coordinates (for<ORFrame>or<XYFrame>) or the array of ids (for<NetworkFrame>) with a bounding box.

-
useBins: Bucketized summary types in<ORFrame>(violin,joy,histogram,heatmap) now honor auseBinsprop in the passedsummaryType. This defaults to true, so that under the hood the summary visualization still uses a binning function (D3's histogram) but if set touseBins: falseit will assume that the passed array of data is a set of coordinates with which to draw the summaryType. This is useful for when you have precalculated positions for your summary visualizations.
Published by emeeks almost 7 years ago
Fixes:
- Some placements would leave points out of the voronoi hovering, this should be fixed
- baseMarkProps was not being passed to node and edge objects
- Sunburst hover tooltips were not being placed correctly
Published by emeeks almost 7 years ago
#Features
- Support for hierarchical layouts
If you send hierarchical data to NetworkFrame (hierarchical JSON to theedgesproperty) you can now use the various hierarchical diagrams in D3 to display that data. SonetworkTypenow honorstree,cluster,circlepack,partitionandtreemapwhich all correspond to D3's tree, cluster, pack, partition and treemap layouts. In cases where a layout can honor differences in projection (such as radial, horizontal or vertical for cluster or radial for partition to make a sunburst) it will honor those as aprojectionproperty ofnetworkType. Other properties passed tonetworkTypethat correspond to properties specific to those layouts, such aspaddingfor treemap and partition, will be passed through.
You can see the interactive example here: https://emeeks.github.io/semiotic/#/dendrogram
Published by emeeks almost 7 years ago
Features
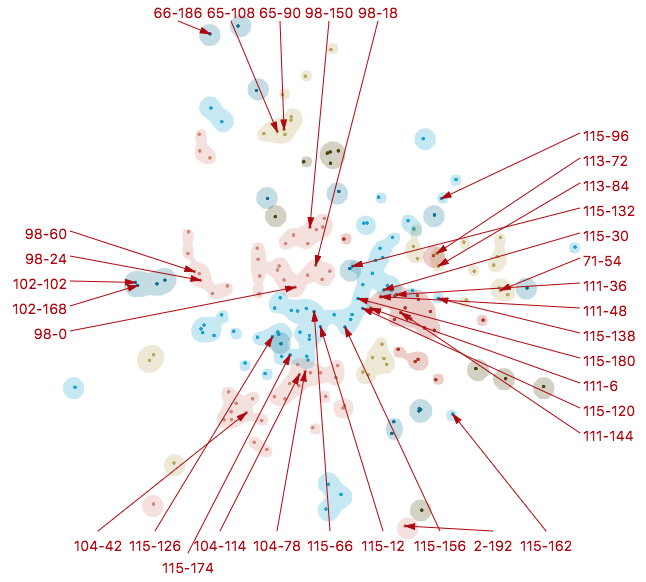
- You can pass custom
d3-forceSimulationsimulations to NetworkFrame, as asimulationparameter in thenetworkType. It's demonstrated here to create bubble charts and multi-foci charts. - All frames have a
baseMarkPropsthat can take an object with props to apply to all marks generated by the frame. This is primarily to leverage the new feature insemiotic-markthat lets you definedtransitionDuration. For now it only takes an object, so you can across the board set transitions to be something other than the 1000ms default that Semiotic has been using up to this point. You can try it out in your frame by adding something like:
baseMarkProps={{ transitionDuration: 2000 }}
To set all transitions to 2 seconds or something more nuanced like:
baseMarkProps={{ transitionDuration: { default: 500, fill: 2500 }}}
To make fill transitions take 2.5 seconds and all other transitions take 0.5 seconds.
-
canvasPieces&canvasConnectorsare now honored in<ORFrame>and will render those elements to canvas.canvasSummariesis still not available. -
canvasPostProcessis available on all frames. It is fired after canvas rendering and is passed(canvas, context, size)so you can graphically modify your chart. For instance if you want it to have a glowy look like this:

You can add the following code to the Frame:
   canvasPostProcess={(canvas, context, size) => {
  const dataURL = canvas.toDataURL("image/png")
  const baseImage = document.createElement("img")

  baseImage.src = dataURL
  baseImage.onload = () => {
    context.clearRect(0, 0, size[0] + 120, size[1] + 120)
    context.filter = "blur(10px)"
    context.drawImage(baseImage, 0, 0)
    context.filter = "blur(5px)"
    context.drawImage(baseImage, 0, 0)
    context.filter = "none"
    context.drawImage(baseImage, 0, 0)
  }}
It also will do a fun Chuck Close style pixelation if you pass canvasPostProcess={"chuckClose"}
Changes
- This uses
[email protected]which no longer uses flubber. Instead, complex shapes that won't transition well don't use transitions. Flubber was too big and still caused distracting changes in shapes when doing the interpolation--it's great for abstract shapes but not so great for the lines and areas in a traditional chart. - Default for
<XYFrame>'slineIDAccessoris nowd => d.semioticLineIDinstead ofd => d.idbecause the latter would conflict with the occasional dataset.
Published by emeeks almost 7 years ago
"timeline" type in ORFrame sends better settings to the customMark generator
Published by emeeks almost 7 years ago
Fixes a major bug where horizontal summaryType was reversed and a little bug where Joy Plots weren't quite aligned.
Published by emeeks almost 7 years ago
Features
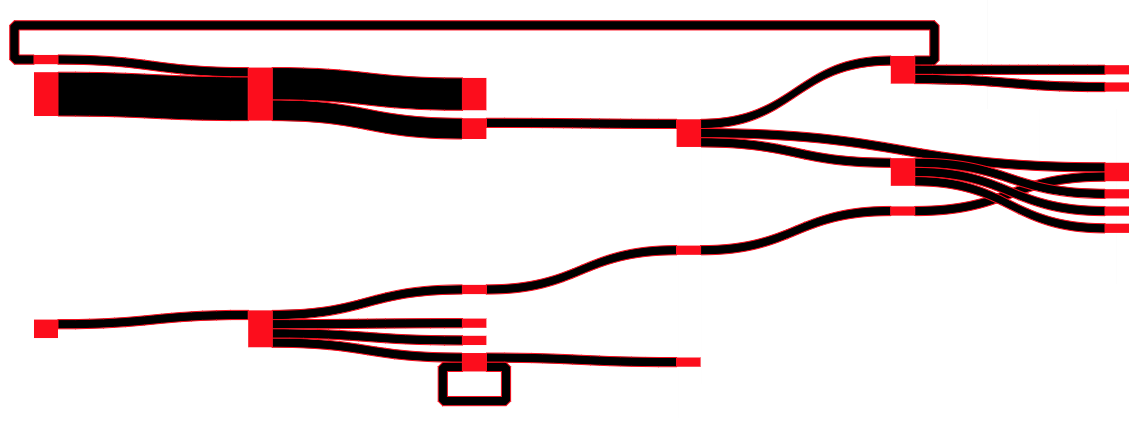
- Sankeys in
NetworkFramenow accept networks with cycles and render them using Tom Shanley'sd3-sankey-circularlayout.
- Add a
relativetag to bucketized summaryTypes inORFrameto allow the visualization to display the relative size of the data (with the max being the max value for that category) as opposed to the default behavior which sizes graphical elements by the max value across all categories.
Fixes
- Margin has been fixed so that passing a numerical value is properly treated as margin for all sides.
Published by emeeks almost 7 years ago
Features:
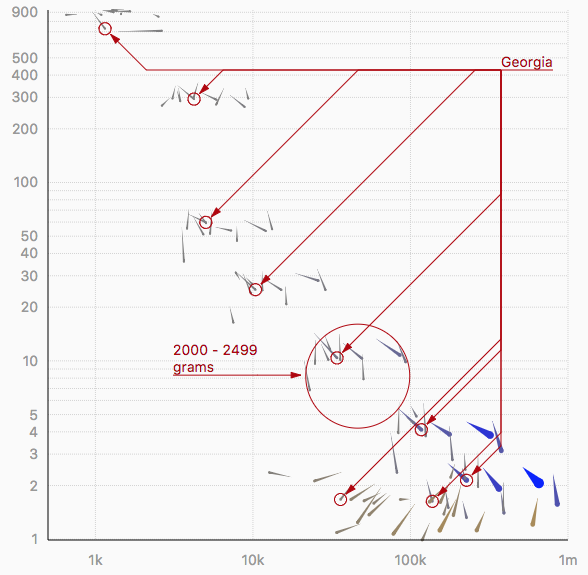
- All axes will automatically draw a
<line>element with classaxis-baselinealong the baseline of the axis. You can restyle or hide it with CSS. -
react-annotationannotations in XYFrame and ORFrame will honor acoordinatesarray and draw multi-subject annotations when you send datapoints in that array. -
customPointMarkin XYFrame can now return any JSX SVG instead of just asemiotic-mark<Mark>element. It also passes{ d, i, xScale, yScale }so you can draw marks whose shape depends on data values in chartspace.
Fixes:
-
motifsmode in NetworkFrame is working again. Singletons are now sorted into a single component.
You can see most of this in action in the Comet Plots example.
Published by emeeks almost 7 years ago
in ORFrame
-
pixelColumnWidthin ORFrame now allows you to specify the size of a column as a number and will result in a frame with a size based on the number of columns times the specified size -
timelineis a new type that requires anrAccessorthat returns a two-piece array that designates start and end of timeline/Gantt chart-style bands of data.
in Axis
-
ticklineGeneratorallows you to specify a function which will be passed ({ xy, orient }) which you can return SVG JSX to draw your own custom ticks -
tickSizeallows you to specify the pixel length/height of the tick generated by the axis. Use negative values to draw away from the chart. Use multiple axes on the same orient if you want to draw and overlap different axes or useticklineGeneratorto draw a more custom tick
Published by emeeks almost 7 years ago
FIXES
- Whole pie piece pie charts will not honor
oPaddingand slices will not end up with negative size if reduced byoPadding. - Annotation handling updates other properties even if it's not required for the annotations to change, also support a
dataVersionflag inbumptype annotation layouts so you can tell it to re-fire the layout - Curly arc brackets were incorrectly calculating the
largeArcFlagresulting in cool but terrible arcs
FEATURES
-
unpkgsupport from @tmcw! - Honor new extents in brushes to allow programmatic brush extents (feature shown in the Swarm Brush, Line Brush and Minimap examples)
NEW EXAMPLES
Show how to use the MinimapXYFrame as an isolated example

https://emeeks.github.io/semiotic/#/semiotic/minimap
Fun with backgroundGraphics
https://emeeks.github.io/semiotic/#/datasketches
Published by emeeks almost 7 years ago
This update resolves a few problems most people wouldn't have run into unless they were using the advanced annotation features, like when your annotation attributes change but your annotation layout doesn't say they need to be repositioned.
It also adds a more accessible new example for a custom type in ORFrame:
https://emeeks.github.io/semiotic/#/semiotic/custommark
Published by emeeks almost 7 years ago
feat: "categories" annotation for ORFrame that displays bracket annotations for categories in a friendly way, see the Violin Chart in the docs.
feat: Expose better drawing instructions for clusterbar type in ORFrame
fix: fix radial ordering bug for middle-ordered types (violin, point, swarm)