Bot releases are hidden (Show)
Published by KronicDeth almost 6 years ago
Published by KronicDeth almost 6 years ago
Published by KronicDeth almost 6 years ago
Published by KronicDeth almost 6 years ago
Published by KronicDeth almost 6 years ago
Published by KronicDeth almost 6 years ago
Published by KronicDeth almost 6 years ago
Published by KronicDeth almost 6 years ago
Published by KronicDeth almost 6 years ago
Published by KronicDeth almost 6 years ago
Published by KronicDeth about 6 years ago
Thanks
- For reporting that renaming variables didn't work on bracket operations, which reminded me I still had the feature open to resolve bracket operation identifiers from 2016(!).
- Raz (@RazgrizHsu)
- For reporting that they wanted Go To Source and Go To Decompiled to be separated
- For let me know that some users were like me and liked being able to jump to decompiled code, which was the impetus for Go To Related support after Go To Declaration switched to preferring source.
- Kimberly Milner (at ElixirConf 2018)
- For reporting that I broke completion through imports when I did the Kotlin conversion back in v7.5.0 (released June 5th 2018) 🤦♂️
- Miroslav Hettes (@mirrec)
v9.0.0
Enhancements
-
#1255 - @KronicDeth
- Resolve calls through
use AnAliascalls-
AnAliaswill be resolved to its modular (module, implementation, or protocol) - The
__using__macro in the modular is found - The last call in
__using__is checked
-
If it is a
quoteblock, check for call definitions recursively inside the block -
If it is an
apply/3call- Resolve the first argument as a modular
- Scan for each function in
modular - In each function Goto Step 3 above
This handling is what specifically makes
use MyAppWeb, :controllerin Phoenix apps now work. -
If it is a general call
- Resolve the call to its definition
- Goto Step 3 above
-
- Resolve calls through
-
#1259 - @KronicDeth
- Go To Related (
Ctrl+Cmd+Up) can be used to Go To the decompiled Module or call definitions when on a source modular (defimpl,defmodule, ordefprotocol) or callable (def,defp,defmacro,defmacrop). This somewhat restores the ability to go to both source and decompiled module and calls before 9.0.0, but now the source is preferred for Go To Declaration and the decompiled will only be available if there is no source and if you definitely want decompiled, you'll need to use Go To Related.
- Go To Related (
Bug Fixes
-
#1245 - Specify that Kotlin Plugin is needed in
CONTRIBUTING.md, so IntelliJ plays nice. - @sfat -
#1246 - @KronicDeth
- Resolve unqualified bracket operation identifiers (
varinvar[key]) to variables or0-arity calls.- Fixes renames of variables not renaming usage of variables for Access lookups (i.e.
var[key]).
- Fixes renames of variables not renaming usage of variables for Access lookups (i.e.
- Resolve unqualified bracket operation identifiers (
-
#1248 - @KronicDeth
- Go To Symbol will no longer show redundant entries
- Call Definitions (
name/arity) is no longer shown if the Call Definition Clause is also included. This isn't a large loss because the/aritywas not searchable and only part of the presentation. - If there is a decompiled and a source version of a symbol, only the source version will be shown.
- The source Implementation will be shown and not the decompiled Module with the same fully-qualified name (
<protocol>.<for>).
- The source Implementation will be shown and not the decompiled Module with the same fully-qualified name (
- Items will be deduped if they point to the same element, such as function clauses with default arguments because when presented they look the same even if internally one is representing
/1and/2, for example.
- Call Definitions (
- Go To Symbol will no longer show redundant entries
-
#1249 - Ensure that Go To Declaration for qualified calls such as
Module.function(...)whereModuleis an alias does not return the decompiled version ofModulewhen the source is available. - @KronicDeth -
#1256 - @KronicDeth
- Fix completion not working for unqualified functions from
imports.- When I switched to using
?.letI accidentally hid theiffrom running when there was noENTRANCE_CALL_DEFINITION_CLAUSE, so the correct form is add if there is no entrance or if there is a non-equivalent entrance. - I just straight up forgot an ! on a contains check. I moved to computeIfAbsent, so it is more obvious what the intent is.
- When I switched to using
- Fix completion not working for unqualified functions from
Incompatible Changs
- #1248 Go To Symbol and Go To Declaration will no longer suggest decompiled modules or functions if source modules or functions of the same name or module/name/arity exists. - @KronicDeth
README updates
Features
Go To Related
Go To Related is like Go To Declaration, but more general, for anything that is related to an element, but not its declaration.
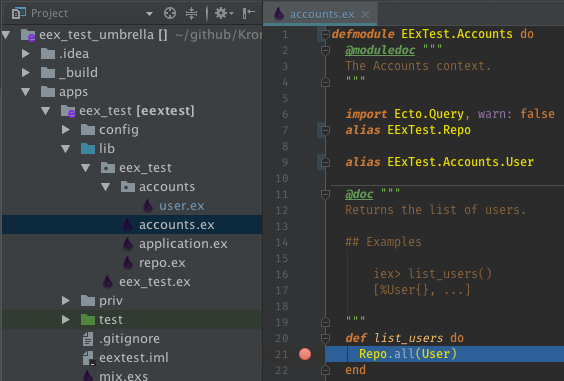
In IntelliJ Elixir, Go To Related can be used to go to the decompiled version of a modular (defimpl, defprotocol, or defmodule) or a callable (def, defp, defmacro, defmacrop) definition.
Decompiled Module
- Place the cursor on the name of the modular, such as
EExTest.Accountsindefmodule EExTest.Accounts do - Go To Related
- Navigate > Related Symbol
Ctrl+Cmd+Up
- Select a "Decompiled BEAM" target from the "Choose Target" context menu

- You will be taken to the decompiled module

Decompiled Call Definition
- Place the cursor on the name of the call, such as
get_user!indef get_user!(id) - Go To Related
- Navigate > Related Symbol
Ctrl+Cmd+Up
- Select a "Decompiled BEAM" target from the "Choose Target" context menu

- You will be taken to the decompiled module

Published by KronicDeth about 6 years ago
Thanks
- For consulting on the design of the new flat icons to match IntelliJ IDEA 2018.2's design guidelines and showing me how to use Figma.
- Narek Khachatryan (@nk8)
- For reporting that
Decimal.base10?could not resolve its enclosing modular- Tomoki Odaka (@odk211)
- For reporting that completion of SDK files was broken in Small IDEs, which led to discovering the External Libraries were needed in Small IDEs for SDK indexing to occur. (Indexing of SDKs is automatic in IntelliJ IDEA.)
- For explaining IntelliJ IDEA 2018.2's design guidlines
- Alina Mishna
- For providing the SVG version of the Elixir icon
- Alina Mishna
- For providing the Elixir icon made by Alina Mishna
- Lidiya Chernigovskaya (LChernigovskaya)
Changelog
v8.1.0
Enhancements
- #1226 - Flat icons to match IntelliJ IDEA 2018.2 design rules. Thanks to @nk8 for consulting on the design and showing me how to use Figma. - @KronicDeth, @nk8
- #1233 - Regression test for #1228 - @KronicDeth
-
#1239 - Use icon provided by Lidiya Chernigovskaya (@LChernigovskaya) and created by JetBrains UX (Alina Mishina) for
pluginIconcompatibility with IntelliJ IDEA 2018.3. - @KronicDeth
Bug Fixes
-
#1233 - Look above
Enum.reducefor enclosing macro call. - @KronicDeth -
#1234 - @KronicDeth
- Add Facet SDK as External Library to re-enable indexing. When the External Library was removed in 4297287 in favor of a real SDK, completion for SDK
.beammodules was lost because Small IDEs don't index SDKs, but only External Libraries, so add Application-wide External Libraries for SDKs when they are created (and update, remove on edit or delete), which are then added as a Dependency for the facet's module when the SDK is set for the Small IDE project.- Convert old modules with Elixir facets to also have External Library, so that users don't need to remove and add the SDKs to get the External Library.
- Add Facet SDK as External Library to re-enable indexing. When the External Library was removed in 4297287 in favor of a real SDK, completion for SDK
-
#1237 - @KronicDeth
-
Use #AEB9C0 for JetBrains Default/Light Gray. Use #87939A for JetBrains Darcula Gray. Colors based on IntelliJ's color picker picking its own colors.
Icon matching testing done under both themes in 2018.2.1. Weirdly, the colors are different in the SVGs in my intellij-community@master. Hopefully, this doesn't mean the colors change again in 2018.3.
-
-
#1244 - @KronicDeth
- Run
createLibraryinsiderunWriteAction. - Remove test that leaks threads and so causes builds to fail.
- Run
Published by KronicDeth about 6 years ago
Thanks
- For reporting NPE in the improved version of the
getPresentation- Tomoki Odaka (@odk211)
- Everett Griffiths (@fireproofsocks)
- Daniel Ashton (@jdashton)
- Rostyslav Melnychuk (@iKethavel)
- Simon Struck (@AnyTimeTraveler)
- Олег Дулецкий (@dog-64)
- lee eggebroten (@leggebroten)
- @j-m-hoffmann
- Ram Kumar (@ramka001)
- Eric des Courtis (@edescourtis)
- Adam Phillips (@aadam21)
- Hammad Ur Rahman (@hammadurrahman)
- For reporting that the safe cast for quote bound variables wasn't so safe
- Gary Cox (@GaryLCoxJr)
- Eugene (@JohnBat26)
- Олег Дулецкий (@dog-64)
- Venelin Petkov (@vmptk)
- Tomoki Odaka (@odk211)
- Sylvain Corsini (@scorsi)
- Zoltán Marić (@zoltanmaric)
- Carlos Brito Lage (@cblage)
- @heldermartins-tdesk
- Jeff Morgan (@cheezy)
- Austin Morris (@austinsmorris)
- Alexandre Audebeau (@azuken)
- Lemon Lyu (@lv12312)
- Klevison Matias (@klevison)
- For reporting the disassembler did not support all OTP 21 opcodes
- lijianfeng (@jxljf)
- For requesting spellchecking
- For reporting that Phoenix's use of
quoteinside a literal[head | tail]list code not be parsed to find the parent modular.- Neftaly Luis (@neftalyluis)
- For reporting that the missing Erlang SDK message wasn't clear clicking OK would take you through the setup and cancel would stop Elixir+Erlang SDK confirmation.
- For reporting that variables use scope could not be calculated in EEx tags.
- For reporting that
@was allowed in atoms, but not atom keyword keys.- Eric Hagman (@emhagman)
- For reporting that
eachEbinPathdid not restrict itself to directories and blow up on files.- Tomoki Odaka (@odk211)
- For reporting that
Module.aliasedNamestill containedasserteven though it usesNormalizedto protect fromPsiErrors.- Rostyslav Melnychuk (@iKethavel)
- For reporting that
Unaliased.downdid not have a useful error message- Eric des Courtis (@edescourtis)
Changelog
v8.0.0
Enhancements
-
#1175 - @KronicDeth
- New and improved Run/Debug Configurations
- Distillery Release CLIs for running
console,foreground, etc
Options for configuring each part of the command line- Path to Release CLI
- Release CLI arguments (like a command
console) - Settings that are normally hidden in environment variables
-
erlarguments (ERL_OPTS) -
elixir -extraarguments (EXTRA_OPTS) - Code Loading Mode (
CODE_LOADING_MODE) - Log Directory (
RUNNER_LOG_DIR) - Replace OS Vars (
REPLACE_OS_VARS) -
sys.configfile (SYS_CONFIG_PATH) - Release Config Directory (
RELEASE_CONFIG_DIR) - Pipe directory (
PIPE_DIR)
-
- Use Pseudo-Terminal (PTY) to allow overriding console type when it can't be inferred from the Release CLI arguments, such as using PTY for
consolebecause it uses aniex-like shell. - Working Directory
- Environment Variables
-
iexconsole with proper PTY support (colors, tab completion, history)
Options for configuring each part of the command line-
iexarguments -
erlarguments - Working Directory
- Environment Variables
-
-
elixirwith colors
Options for configuring each part of the command line-
elixirarguments -
erlarguments - Working Directory
- Environment Variables
-
-
mixtasks getting expanded options to match the new configurations-
mixarguments, which used to be called "Program Arguments" (I figured out how to customize that name. 😉) -
elixirarguments -
erlarguments - Working Directory
- Environment Variables
-
-
iex -S mix
Options for configuring each part of the command line-
mixarguments -
iexarguments -
erlarguments - Working Directory
- Environment Variables
-
-
mix test-
mix testarguments, which used to be called "Program Arguments" -
elixirarguments -
erlarguments - Working Directory
- Environment Variables
-
- Distillery Release CLIs for running
- Debugger enhancements
- All the above configurations can be debugged using the debugger. It is no longer restricted to only working with
mix-based configurations. - Filter more common dependency modules from being interpreted by default.
credoinch_exearmarkex_doc
- More ways to filter interpreted modules
- Run Configurations now have an Interpreted Modules tab, next to Configuration, which by default imports the Application-wide settings, but allows
- Disabling inherited filters
- Adding configuration-specific filters
- Remove configuration-specific filters
- Allow interpreted modules to be uninterpreted when the debugger is running, using the "Interpreted Modules" tab.
- Run Configurations now have an Interpreted Modules tab, next to Configuration, which by default imports the Application-wide settings, but allows
- Improved Variables pane by showing the Elixir name of variables instead of Erlang names
- Evaluate can evaluate an Elixir expression in any stack frame.
- All the above configurations can be debugged using the debugger. It is no longer restricted to only working with
- New and improved Run/Debug Configurations
-
#1192 - @KronicDeth
-
Add all OTP 21 opcodes to disassembler. Previous opcode set was
frozen prior to OTP 21 release and missed some later additions.number name Added 160build_stacktraceBefore OTP 21 release 161raw_raiseNow 162get_hdNow 163get_tlNow
-
-
#1196 - @KronicDeth
- Spell checking for identifiers, aliases, comments, and literals (charlists, strings, and sigils).
- Dictionaries for common dependencies
- Elixir
- Ecto
- Dictionaries for common dependencies
- Spell checking for identifiers, aliases, comments, and literals (charlists, strings, and sigils).
-
#1203 - @KronicDeth
- Elixir 1.7 debugger Variables and Evaluate compatibility
- Elixir 1.7 names Erlang variables like
_<elixirVariableName>@<counter>while Elixir 1.6 usedV<elixirVariableName>@<counter> - Elixir 1.7 changed
elixir_erlrecord and%Macro.Env{}, which changed how:elixir.quoted_to_erlneeded to be called.
- Elixir 1.7 names Erlang variables like
- Elixir 1.7 debugger Variables and Evaluate compatibility
-
#1208 - Update
2018.2to2018.2.1in build matrix. - @KronicDeth - #1210 - Regression test for #1141 - @KronicDeth
- #1212 - Improve Cannot Create SDK error message (additions in bold): "You need to configure an Erlang SDK for Elixir SDK. Click OK to be take through the Erlang SDK configuration. Click Cancel to stop configuring this SDK AND the Erlang SDK." - @KronicDeth
- #1223 - Convert mix and mix test run configurations to new format. - @KronicDeth
Bug Fixes
-
#1188 - Show
...for module name whenDbgihas no module name as happens for instrumented modules fromIEx.break/4. - @KronicDeth -
#1189 - Don't assume
callDefinitionClauseis non-null. - @KronicDeth -
#1190 - Don't assume parent of list access expression is
QuotableKeywordPair- @KronicDeth - #1191 - Don't assume parent of keywords is a list. - @KronicDeth
-
#1208 -
TerminalExecutionConsoleitself echos input in2018.2and2018.2.1, which was introduced in https://github.com/JetBrains/intellij-community/commit/fd7bbd0cb7f3c2a5add8872e0e6c5172be5f074a#diff-5acc2eb2e78fe52d7458d4a48b0eac9f, but it was reverted in JetBrains/intellij-community@5f4465b, so this uses that version to maintain compatibility across supported versions. - @KronicDeth -
#1210 - In
Phoenix.Router.Helpers, aquoteblock appears as the head of[head | tail]list, so add support for search for enclosing macro call above|. - @KronicDeth -
#1213 - Treat EEx tag the same as
StabBodyfor use scope. - @KronicDeth -
#1214 - Use
ATOMfor keyword keys instead ofIDENTIFIER_TOKENasATOMallows for@, which is needed for correctness. - @KronicDeth -
#1215 - In
eachEbinPath, the ebin directories were found by iterating<SDK_HOME_PATH>/liband then iterating grandchild of that, so that all paths matching<SDK_HOME_PATH>/lib/<APP>/ebinwould be added, but for some installs from source, like SDK, there are non-OTP-app files in<SDK_HOME_PATH>/lib, so filter<SDK_HOME_PATH>/lib/<APP>to only directories. - @KronicDeth -
#1216 -
org.elixir.lang.psi.scope.Module.aliasedName(QualifiedAlias)was already converted to useorg.elixir_lang.psi.operation.Normalizedandorg.elixir_lang.psi.infix.Normalized, which makes it work with errors in the PSI tree, so there's no need protect with an assert and that assert would be wrong in times of errors handled byNormalized. - @KronicDeth -
#1217 -
org.elixir_lang.reference.module.UnaliasedName.down(PsiElement)only expectsElixirAccessExpressionorQualifiableAlias, but for unexpected classes of elements, it was a simple KotlinTODO(), which didn't log anything useful for enhancements. Replace theTODO()with anorg.elixir_lang.errorreport.Logger.error, so that the element's class and content can be reported when this happens again. - @KronicDeth -
#1164 - Use
/in paths passed to Erlang, even on Windows - @notriddle
Incompatible Changes
-
#1175 - Drop support for IntelliJ IDEA before 2017.3 as they lack the
TerminalExecutionConsoleused to runiexin a PTY. - @KronicDeth
README Updates
Features
Debugger
Steps
- Define a run/debug configuration
-
Create breakpoints in the
*.exfiles - Launch a debugging session
- During the debugger session, step through the breakpoints, examine suspended program, explore frames, and evaluate code when suspended.
Starting the Debugger Session
It takes awhile, once the debugged process is started to configure the debugger in BEAM. To ensure that breakpoints are setup before allow the debugged code to run, the debugger blocks until setup is complete.
- The debugged process will wait for the debugger to attach

- Breakpoints will be set
- The debugger will mark modules to be interpreted
- The code paths will be scanned for
.beamfiles- Code paths from the Elixir SDK will be skipped

-
.beamfiles will be interpreted unless they match the Module Filter Pattern

- Code paths from the Elixir SDK will be skipped
- The code paths will be scanned for
- The debugger attaches (so it can receive breakpoint events) and allows the debugged process to continue.

Examining Suspended Program
Variables

Binaries show each byte at the byte's offset.

Bitstrings show each byte with any partial byte annotated with its bitwidth.

Boolean variables are rendered as their value.

Charlists show the integer values because they're treated as lists

Functions don't have literal representation, so the inspect form starting with #Fun<...> is shown

Lists render differently based on whether the list is improper or not. Improper lists show the head and tail while proper lists show their element by offset.

Maps render differently based on the key type. If the map uses all atom keys, the key will equal the value in the nested children while non-atom keys are shown as entries at a specific offset with the key and value. This is done, so that complex keys that have subterms can be expanded or collapsed, which is not possible for the simpler atom rendering.

Floats and integers are rendered as literals.

Pids are broken up into their hidden node, id, and serial`.

Strings show their literal value and unicode is fully supported.

Tuples show their elements at their offsets.

While Elixir allows rebinding variable names, Erlang does not, so when viewed in the Variables pane, rebound variables will have an @VERSION after their name indicating which rebinding of a the variable is.
Evaluate
When stopped at a breakpoint, you can use the Evaluate button (it looks like a simple pocket calculator) to open an editor to type code to be executed in the current stack frame.

The evaluator supports the full syntax.

The result of evaluating the code with be shown as the value of result below the entered "Expression".


Errors in the code will report back as a result tuple with an :EXIT tag. This reflects that the error has crashed the process that was evaluating the code. Thankfully, due to how how the interpreter is written, this does not lose the current stack frame and stepping or other evaluation can continue.
Run/Debug Configurations
Distillery Release CLI 
Distillery's mix release produces a CLI for running the release.
- Build the release:
mix release==> Release successfully built! You can run it in one of the following ways: Interactive: _build/ENV/rel/NAME/bin/NAME console Foreground: _build/ENV/rel/NAME/bin/NAME foreground Daemon: _build/ENV/rel/NAME/bin/NAME start - Run > Edit Configurations...

- Click +
- Select "Distillery Release CLI"

- Fill in the "Release CLI Path" with the full path to the
_build/ENV/rel/NAME/bin/NAMEpath produed bymix releaseabove. - Fill in the "Release CLI arguments".
-
consoleruns a shell with the release loaded similar toiex -S mix. -
foregroundto runs the release without a shell, likemixormix run.
The available commands are controlled by your release configrel/config.exsthat Distillery uses.
-
- (Optionally) fill in "
erlarguments" with arguments toerlbefore it runselixir.
This is the same as theERL_OPTSenvironment variable supported by Distillery. - (Optionally) fill in "
elixir -extraarguments" with arguments to pass toelixirbefore it run the release.
This is the same as theEXTRA_OPTSenvironment variable supported by Distillery. - (Optionally) change the Code Loading Mode
This is the same as theCODE_LOADING_MODEenvironment variable supported by Distillery.- Use Default - use whatever is configured in
rel/config.exs. Don't setCODE_LOADING_MODEenvironment variable. -
embedded- load all code immediately on boot. SetCODE_LOADING_MODE=embedded. -
interactive- load code on-demand as it is needed/referenced. SetCODE_LOADING_MODE=interactive.
- Use Default - use whatever is configured in
- (Optionally) set the "Log Directory"
This is the same as theRUNNER_LOG_DIRenvironment variable supported by Distillery. - (Optionally) change "Replace OS Vars"
This is the same as theREPLACE_OS_VARSenvironment variable supported by Distillery.- Use Default - use whatever is configured in
rel/config.exs. Don't setREPLACE_OS_VARSenvironment variable. -
false- don't replace "${A_VAR_NAME}" in the generated configuration withA_VARenvironment variable at runtime. SetREPLACE_OS_VARS=false. -
true- replace "${A_VAR_NAME}" in the generated configuration withA_VARenvironment variable at runtime. SetREPLACE_OS_VARS=true.
- Use Default - use whatever is configured in
- (Optionally) set "
sys.configFile"
This is the same theSYS_CONFIG_PATHenvironment variable supported by Distillery. - (Optionally) set "Release Config Directory".
This is the same as theRELEASE_CONFIG_DIRenvironment variable supported by Distillery. - (Optionally) set "Pipe directory".
This is the same as thePIPE_DIRenvironment variable supported by Distillery. - (Optionally) set "Use Pseudo-terminal (PTY).
If checked use PTY for interactive shells. Automatically on when "Release CLI Arguments" starts with one of the known interactive commands (attach,console,console_boot,console_clean, orremote_console). - Fill in the "Working directory.
- Type the absolute path to the directory.
- Select the path using directory picker by clicking the
...button
- (Optionally) click the
...button on the "Environment variables" line to add environment variables. - Click "OK" to save the Run Configuration and close the dialog
Running
- Click the Run Arrow in the Toolbar to run the
_build/ENV/rel/NAME/bin/NAME - The Run pane will open
- If the either "Use Pseduo-terminal (PTY)" is checked of the "Release CLI Arguments" are known to need a PTY, an interactive shell will appear in the Run pane where you can enter
iexcommands. - Otherwise, the output of running the command will be shown.
- If the either "Use Pseduo-terminal (PTY)" is checked of the "Release CLI Arguments" are known to need a PTY, an interactive shell will appear in the Run pane where you can enter
Debugging
- (Optionally) before debugging, customize the modules that will be interpreted.
- Run > Edit Configurations...
- Click the "Interpreted Modules" tab next to default "Configuration" tab.
- Enable/Disable "Inherit Application Module Filters". Will change the Module Filters show in the below "Do not interpreter modules matching patterns" list.
- Uncheck any inherited module filters that you would rather be interpreted and therefore debuggable
- Click + to add module filters that are specific to this configuration. This can be useful if you know interpreting a specific module in your project's dependencies or project leads to too much slowdown when debugging or causes the debugger to hang/crash.
- Click - to remove configuration-specific module filters added with +. Inherited module filters cannot be removed with -, they can only be disabled by unchecking.
- Add the
:debuggerapplication to your release- Open
rel/config.exs - In the
release NAMEblock, in theset :applicationsblock add:debugger:--- a/rel/config.exs +++ b/rel/config.exs @@ -41,6 +41,8 @@ end release :intellij_elixir do set version: current_version(:intellij_elixir) set applications: [ + # needed for IntelliJ Elixir debugger + :debugger, :runtime_tools ] end
- Open
- For how to use the debugger, including how to set breakpoints see the Debugger section.
- Click the Debug bug in the Toolbar to debug the
mix tests
Elixir 
Although it is exceedingly rare, as most Elixir projects use mix, it is supported to run/debug elixir directly, such as when doing elixir script.exs.
- Run > Edit Configuations...
- Click +
- Select "Elixir"

- Fill in the "
elixirarguments". - (Optionally) fill in "
erlarguments" with arguments toerlbefore it runselixir. - Fill in the "Working directory"
- Type the absolute path to the directory.
- Select the path using directory picker by clicking the
...button
- (Optionally) click the
...button on the "Environment variables" line to add environment variables. - Click "OK" to save the Run Configuration and close the dialog
With the Run Configuration defined, you can either Run or Debug elixir
Running
- Click the Run arrow in the Toolbar to run
elixir.

- The Run pane will open, showing the results of
elixir.
Debugging
- (Optionally) before debugging, customize the modules that will be interpreted.
- Run > Edit Configurations...
- Click the "Interpreted Modules" tab next to default "Configuration" tab.
- Enable/Disable "Inherit Application Module Filters". Will change the Module Filters show in the below "Do not interpreter modules matching patterns" list.
- Uncheck any inherited module filters that you would rather be interpreted and therefore debuggable
- Click + to add module filters that are specific to this configuration. This can be useful if you know interpreting a specific module in your project's dependencies or project leads to too much slowdown when debugging or causes the debugger to hang/crash.
- Click - to remove configuration-specific module filters added with +. Inherited module filters cannot be removed with -, they can only be disabled by unchecking.
- For how to use the debugger, including how to set breakpoints see the Debugger section.
- Click the Debug bug in the Toolbar to debug
elixir
IEx (Interactive Elixir)
iex run configurations allow you to run iex with IntelliJ Elixir attached. It is most useful when debugging, but it also allows you save customizations in the configuration when it is more complicated than just iex.
- Run > Edit Configurations...
- Click +
- Select "IEx"

- (Optionally) fill in "
iexarguments" with arguments toiex. - (Optionally) full in "
erlarguments" with arguments toerlbefore it runsiex. - Fill in the "Working directory"
- Type the absolute path to the directory.
- Select the path using directory picker by clicking the
...button
- (Optionally) click the
...button on the "Environment variables" line to add environment variables. - Click "OK" to save the Run Configuration and close the dialog
With the Run Configuration defined, you can either Run or Debug the iex configuration.
Running
- Click the Run arrow in the Toolbar to run
iex

Debugging
- (Optionally) before debugging, customize the modules that will be interpreted.
- Run > Edit Configurations...
- Click the "Interpreted Modules" tab next to default "Configuration" tab.
- Enable/Disable "Inherit Application Module Filters". Will change the Module Filters show in the below "Do not interpreter modules matching patterns" list.
- Uncheck any inherited module filters that you would rather be interpreted and therefore debuggable
- Click + to add module filters that are specific to this configuration. This can be useful if you know interpreting a specific module in your project's dependencies or project leads to too much slowdown when debugging or causes the debugger to hang/crash.
- Click - to remove configuration-specific module filters added with +. Inherited module filters cannot be removed with -, they can only be disabled by unchecking.
- For how to use the debugger, including how to set breakpoints see the Debugger section.
- Click the Debug bug in the Toolbar to debug
iex.
Mix Tasks 
Much like rake tasks in Rubymine, this plugin can run mix tasks.
- Run > Edit Configurations...
- Click +
- Select "Elixir Mix"

- Fill in the "
mixarguments" starting with the name of themixtask followed by any arguments to that task. - (Optionally) fill in "
elixirarguments" with arguments toelixirbefore it runsmix. - (Optionally) fill in "
erlarguments" with arguments toerlbefore it runselixir. - Fill in the "Working directory"
- Type the absolute path to the directory.
- Select the path using directory picker by clicking the
...button
- (Optionally) click the
...button on the "Environment variables" line to add environment variables. - Click "OK" to save the Run Configuration and close the dialog
With the Run Configuration defined, you can either Run or Debug the Mix Task
Running
- Click the Run arrow in the Toolbar to run the
mixtask

- The Run pane will open, showing the results of the
mixtask.- If there is an error with a FILE:LINE stack stack_frame, it will be a clickable link that will take you to that location

- If there is an error with a FILE:LINE stack stack_frame, it will be a clickable link that will take you to that location
Debugging
- (Optionally) before debugging, customize the modules that will be interpreted.
- Run > Edit Configurations...
- Click the "Interpreted Modules" tab next to default "Configuration" tab.
- Enable/Disable "Inherit Application Module Filters". Will change the Module Filters show in the below "Do not interpreter modules matching patterns" list.
- Uncheck any inherited module filters that you would rather be interpreted and therefore debuggable
- Click + to add module filters that are specific to this configuration. This can be useful if you know interpreting a specific module in your project's dependencies or project leads to too much slowdown when debugging or causes the debugger to hang/crash.
- Click - to remove configuration-specific module filters added with +. Inherited module filters cannot be removed with -, they can only be disabled by unchecking.
- For how to use the debugger, including how to set breakpoints see the Debugger section.
- Click the Debug bug in the Toolbar to debug the
mixtask
IEx Mix
If you want to run iex in the context of the project, you need to run iex -S mix, but if you don't want to have to worry about forgetting whether it's -s or -S or if it is mix -S iex or iex -S mix, you can use an IEx Mix configuration.
- Run > Edit Configurations...
- Click +
- Select "IEx Mix"

- (Optionally) fill in "
mixarguments", such asphx.serverif you want to launch Phoenix inside ofiex. - (Optionally) fill in "
iexarguments" with arguments toiexbefore-S mix. - (Optionally) full in "
erlarguments" with arguments toerlbefore it runsiex. - Fill in the "Working directory"
- Type the absolute path to the directory.
- Select the path using directory picker by clicking the
...button
- (Optionally) click the
...button on the "Environment variables" line to add environment variables. - Click "OK" to save the Run Configuration and close the dialog
Wih the Run Configuration defined, you can either Run or Debug iex -S mix
Running
- Click the Run Arrow in the Toolbar to run
iex -S mix
Debugging
- (Optionally) before debugging, customize the modules that will be interpreted.
- Run > Edit Configurations...
- Click the "Interpreted Modules" tab next to default "Configuration" tab.
- Enable/Disable "Inherit Application Module Filters". Will change the Module Filters show in the below "Do not interpreter modules matching patterns" list.
- Uncheck any inherited module filters that you would rather be interpreted and therefore debuggable
- Click + to add module filters that are specific to this configuration. This can be useful if you know interpreting a specific module in your project's dependencies or project leads to too much slowdown when debugging or causes the debugger to hang/crash.
- Click - to remove configuration-specific module filters added with +. Inherited module filters cannot be removed with -, they can only be disabled by unchecking.
- For how to use the debugger, including how to set breakpoints see the Debugger section.
- Click the Debug bug in the Toolbar to debug
iex -S mix.
mix test
The mix test task gets a special type of Run Configuration, Elixir Mix ExUnit. Using this Run Configuration type instead, of the basic Elixir Mix Run Configuration will cause the IDE to attach a special formatter to mix test, so that you get the standard graphical tree of Test Results
The Run pane will show Test Results. If there is a compilation error before or during mix test, it will be shown as a test failure. If the compilation failure is in a _test.exs file can it can be inferred from the stacktrace, the compilation error will show up as a test failure in that specific module.
doctest names are rearranged to emphasize the function being tested: "test doc at MODULE.FUNCTION/ARITY (COUNT)" becomes "MODULE.FUNCTION/ARITY doc (COUNT)". If MODULE is the same as the test case without the Test suffix, then MODULE is stripped too and the test name becomes only FUNCTION/ARITY doc (COUNT).
Creating mix test Run Configurations Manually
- Run > Edit Configurations...
- Click +
- Select "Elixir Mix ExUnit"

- Fill in the "
mix testarguments" with the argument(s) to pass tomix test. Normally, this will be a directory liketest, relative to the "Working directory" - (Optionally) fill in "
elixirarguments" with the arguments toelixirbefore it runsmix test. - (Optionally) fill in "
erlarguments"with the arguments toerlbefore it runselixir`. - Fill in the "Working directory"
- Type the absolute path to the directory.
- Select the path using directory picker by clicking the
...button
- (Optionally) click the
...button on the "Environment variables" line to add environment variables. - Click "OK" to save the Run Configuration and close the dialog
With the Run Configuration defined you can either Run or Debug the mix tests
Running
- Click the Run arrow in the Toolbar to run the
mix testtask - The Run pane will open showing the Test Results

Debugging
- (Optionally) before debugging, customize the modules that will be interpreted.
- Run > Edit Configurations...
- Click the "Interpreted Modules" tab next to default "Configuration" tab.
- Enable/Disable "Inherit Application Module Filters". Will change the Module Filters show in the below "Do not interpreter modules matching patterns" list.
- Uncheck any inherited module filters that you would rather be interpreted and therefore debuggable
- Click + to add module filters that are specific to this configuration. This can be useful if you know interpreting a specific module in your project's dependencies or project leads to too much slowdown when debugging or causes the debugger to hang/crash.
- Click - to remove configuration-specific module filters added with +. Inherited module filters cannot be removed with -, they can only be disabled by unchecking.
- For how to use the debugger, including how to set breakpoints see the Debugger section.
- Click the Debug bug in the Toolbar to debug the
mix tests
While you can create Elixir Mix ExUnit run configurations manually using the Run > Edit Configurations... menu, it is probably more convenient to use the context menu.
Creating mix test Run Configurations from context
The context menu must know that the the directory, file, or line you are right-clicking is a test. It does this by checking if the current directory or an ancestor is marked as a Test Sources Root.
- In the Project pane, ensure your OTP application's
testdirectory is marked as a Test Sources Root - Check if the
testdirectory is green. If it is, it is likely a Test Sources Root. This color may differ in different themes, so to be sure you can check the context menu - Right-click the
testdirectory. - Hover over "Mark Directory As >"
* If "Unmark as Test Sources Root" is shown, then the directory is already configured correctly, and create from context will work.

* If "Test Sources Root" is shown, then the directory need to be configured by clicking that entry

Creating/Running mix test Run Configurations from directory
- Right-click the directory in the Project pane
- Click "Run Mix ExUnit", which will both create the Run Configuration and Run it.

- If you want to only create the Run Configuration, select "Create Mix ExUnit" instead
Alternatively, you can use keyboard shortcuts
- Select the directory in the Project pane.
-
Ctrl+Shift+Rwill create the Run Configuration and Run it.
Creating/Running mix test Run Configurations from file
- Right-click the file in the Project pane
- Click "Run Mix ExUnit", which will both create the Run Configuration and Run it.
- If you want to only create the Run Configuration, select "Create Mix ExUnit" instead
Alternatively, you can use keyboard shortcuts
- Select the directory in the Project pane.
-
Ctrl+Shift+Rwill create the Run Configuration and Run it.
Finally, you can use the editor tabs
- Right-click the editor tab for the test file you want to run

- Click "Run Mix ExUnit", which will both create the Run Configuration and Run it.
- If you want to only create the Run Configuration, select "Create Mix ExUnit" instead
Creating/Running mix test Run Configurations from line
If you want to be able to run a single test, you can create a Run Configuration for a line in that test
- Right-click a line in the test file

- Click "Run Mix ExUnit", which will both create the Run Configuration and Run it.
- If you want to only create the Run Configuration, select "Create Mix ExUnit" instead
Alternatively, you can use keyboard shortcuts
- Place the cursor on the line you want to test
-
Ctrl+Shift+Rwill create the Run Configuration and Run it.
Published by KronicDeth over 6 years ago
Thanks
- For reporting that
true:andfalse:did not work as keyword keys- Wes Oldenbeuving (@Narnach)
- For reporting that creating the editor panel for the BEAM Chunks Code editor at boot raised an "Access is allowed from event dispatch thread only." error.
- @mgom
- Anton Medvedev (@antonmedv)
- Bryan Clark (@moenzuel)
- David (@davit555)
- Stephan Kämper (@s2k)
- Andrei Dziahel (@develop7)
- Tomasz Wiśniewski (@quaint)
- Олег Дулецкий (@dog-64)
- Carlos Brito Lage (@cblage)
- Markus Lervik (@horros)
- @simapetr85
- @kevinhagel
- Yarik (@yarikc)
- Tomislav (@trajakovic)
- For reporting that creating the editor panel for the BEAM Chunks Documentation editor at boot raised an "Access is allowed from event dispatch thread only." error.
- Ram Kumar (@ramka001)
- @aby2503
- Zoltán Marić (@zoltanmaric)
- David (@davit555)
- For requesting that
#{auto-close with}- Matt Briggs (@mbriggs)
- For reporting a potential race-condition that led to pre-maturely decompiling an incomplete
.beamfile when it is being rebuilt.- Callum Dempsey Leach (@mmacheerpuppy)
- Kevin Kaland (@wizonesolutions)
- Iuri L. Machado (@imetallica)
- Fabian Sosa Escalada (@zurcacielos)
- For reporting that the bad
.beamfiles that are test cases in Erlang's:kerneltest code were correctly caught by the bug reporter, but they should be ignored since they're a known failure.- S. M. AMRAN (@netcse)
- For reporting the null argument being passed for
startingReferenceinElixirPsiImplUtil.aliasToModular.- Szymon Jeż (@szymon-jez)
- Josh Taylor (@joshuataylor)
- Markus Lervik (@horros)
Changelog
v7.5.0
Enhancements
-
#1055 - Refactor
ElixirPsiImplUtilinto separate files tied to specific classes or interfaces to shrink its size. - @KronicDeth -
#1073 - Complete
#{with}. - @KronicDeth -
#1109 - @KronicDeth
- Read Write Accessor Detector
- Variable/Parameter declarations/rebindings are highlighted as writes while other usages are highlighted as reads.
- Improved Find & Show Usages
- Added Find & Show Usages for Functions at declaration and usage site
- Multi-clause functions use all clauses as targets and find usages of all clauses.
- Improved Find & Show Usages for Modules/Aliases
- Added Find & Show Usages for Functions at declaration and usage site
- Improved Element Descriptions
- It is easier to distinguish
aliases and thedefmodulethat is being aliased because element description now includealiasordefmodulebefore the Alias name based on how the Alias is defined in the scope. - Call definitions use the same presentation for Structure View and Find Usages, so that Compile/Runtime time icons, and visibility are the same in both.
- It is easier to distinguish
- Read Write Accessor Detector
- #1111 - Regression test for #1091 - @KronicDeth
- #1120 - Add regression tests for #1116 that test that parameter and variables can be renamed. - @KronicDeth
-
#1124 - Update IntelliJ versions in build matrix to include
2018.1and latest patch version of other versions. - @KronicDeth -
#1126 - @KronicDeth
- Add Elixir 1.6.X to build matrix
- Update grammar and quoter to match native 1.6 behavior when SDK is >= 1.6.
- New default SDK level is 1.7 to handle builds from
master.
- #1127 - Regression test for #1105 - @KronicDeth
Bug Fixes
-
#1056 - Certain
.beamfiles in the OTP source are purposely invalid, so ignore them when trying to parse and don't log the expected error. - @KronicDeth -
#1060 - Log available bytes and total size when header is not
FOR1. - @KronicDeth -
#1071 -
erl_abstract_codeformatDbgichunks can now be navigated similar to howelixir_erlformat Dbgi chunks can be navigated. Instead of converting the Erlang Abstract Code back to Erlang, which would not be highlighted if intellij-erlang and requires the user to know Erlang, the Erlang Abstract Code is translated back to Elixir source, so you can use the Dbgi chunk view to translate Erlang to Elixir. - @KronicDeth -
#1111 - Allow zero or more new lines after the struct name before the opening curly brace (
{). - @KronicDeth -
#1112 - @KronicDeth
-
In order to prevent
Access is allowed from event dispatch thread onlyerrors when creating read-only code editor in subtabs of the BEAM Chunks editor, only create those editors when their parent tab is selected.Affected tabs:
- Code (Elixir & Erlang)
- ExDc
- Dbgi (Elixir & Erlang)
-
- #1114 - Check for suffix instead of full match to detect predefined macros when annotating. Location strings have become more complex, such as including the file path for root level modules, so the old exact matching on the module name no longer works. - @KronicDeth
-
#1120 - Restore parameter and variable rename. It broke because the changes to make Find Usages work and have Go To Declaration default to Find Usage when there is only one target disabled the default selected element code that the
VariableInplaceRenameHandlerused. - @KronicDeth -
#1121 - @KronicDeth
- Allow module attribute declaration to resolve to itself, so that unused module attributes don't say they can't find the declaration.
- Restore rename module attributes.
-
#1127 - Allow
trueandfalseto be keyword keys. - @KronicDeth
README Updates
Features
.beam Files
BEAM Chunks
Dbgi
Tab
The Dbgi tab appearance varies based on whether it was created with Erlang or Elixir, reflecting the fact that the Dbgi format is dependent on the backend that wrote it.
####### Elixir (:elixir_erl backend)
The Dbgi tab show the single value map entries: :file, :line, and :module.

For the multi-value keys: :attributes, :compile_opts, and :definitions, there are individual tabs.

######## Attributes
The Attributes tab has the same format as the Attrs chunk.

######## Compile Options
The Compile Options tab is usually empty, much like the CInf options key for Erlang.

######## Definitions
The Definitions tab is split between a tree of Module, Function/Arity and clauses.

Clicking on a clause will show only that clause, but clicking on a higher level in the tree will show all clauses in the function or the entire Module.


The AST stored in the definitions tab and the process of converting it back to code is not format preserves, so it will not look precisely like the source code as the AST has undergone some macro expansion before its put in the Dbgi chunk. As common idioms are understood, reversals will be add to the renderer.
####### Erlang (:erlang_abstract_code backend)
The Dbgi tab has Abstract Code and Compile Options tabs.

######## Abstract Code
The Abstract Code tab is split between a tree of Attributes, Functions, Function/Arity, and clauses.

Clicking on a clause will show only that clause, but clicking on a higher level in the tree will show all clauses in the function or the entire Module.


The abstract code stored in the :erlang_abstract_code backend format is the Erlang Abstract Format. Instead of converting the Erlang Abstract Format back to Erlang, which would require IntelliJ Erlang to highlight and annotate and for you to be used to reading Erlang, the Erlang Abstract Format is translated back to Elixir. Using the BEAM Chunk Dbgi viewer can be a way to convert compiled Erlang code to Elixir source automatically.
Find Usages and Show Usages
Find Usages is a feature of JetBrains IDEs. It is the dual of Go To Declaration. While Go To Declaration jumps from a usage to the declaration, Find Usages finds all usages that could jump to a declaration. When used on a usage, Find Usage first finds the declaration(s) and then finds usages of those declaration(s).
Find Usages will open all the found usages in the Find Tool Window (unless you have it configured to not open and jump direct if only one usage is found). If you want to jump to usages quickly, Show Usages, which opens a lookup dialog at the cursor and allows you to select a usage to jump to in the lookup dialog with the arrow keys may be more useful.
Function
- Place the cursor over the name of a function, such as
hdin the definitiondef hd([h | t]]) doorhdin a usagehd(list). - Active the Find Usages action with one of the following:
Alt+F7- Select Edit > Find > Find Usages from the menu.
- A Find Usages dialog will appear in the Find Tool Window.
If a function has multiple clauses, all clauses for the function will be resolved and used as targets.

You can be sure that all clauses were correctly identified as targets because of the multiple entries in the top "Functions" target grouping.

If instead of bringing up the Find Tool Window, you'd like a lookup dialog above the cursor, you can use Show Usages.
- Place the cursor over the name of a function, such as
hdindef hd([h | t]]) do - Active the Show Usages action with one of the following:
Alt+Cmd+F7- Select Edit > Find > Show Usages from the menu.
- A Usages lookup will appear above the cursor.
- Select an element from the lookup to jump to that usage
Published by KronicDeth over 6 years ago
Thanks
- For reporting
bcryptkilled the debugger- Dominik Guzei (@DominikGuzei)
- @SyedWasiHaider
- Alastair Surin (@asurin)
- For reporting
lz4andre2killed the debugger- Samir Sabri (@hopewise)
- For reporting
asdfSDK incompatibilities and correct configuration- @vheathen
- César Izurieta (@cesarizu)
- Marcos Benatti Lauer (@mbenatti)
- Tim Gilbert (@timgilbert)
- Kevin Kaland (@wizonesolutions)
- Rodney Folz (@folz)
- Tsuharesu (@tsuharesu)
- Jefferson Queiroz Venerando (@shamanime)
- Nils Ivanson (@nivanson)
- Percy Grunwald (@pgrunwald)
- For finally forcing me to need to use ASDF for his Nerves training, so I had to install and make it as an SDK 😀
- Greg Mefford (@GregMefford)
Changelog
v7.4.0
Enhancements
-
#1036 - @KronicDeth
- Clean up debugger
-
mix formatdebugger - Restructure debugger.
- Convert IDE-side to Kotlin
-
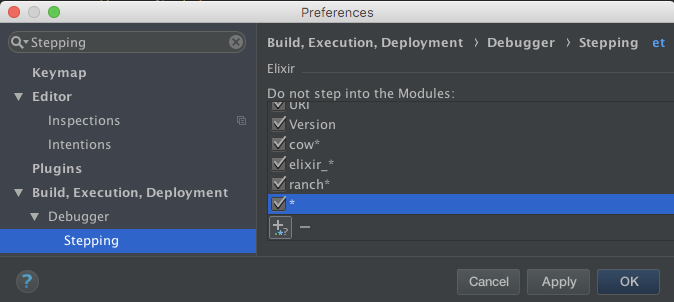
- Allow files to skip interpreting in the debugger to be configured in Preferences > Build, Execution, Deployment > Debugger > Stepping. It is recommended to customize these settings instead of using
INTELLIJ_ELIXIR_DEBUG_BLACKLISTenvironment variable.INTELLIJ_ELIXIR_DEBUG_BLACKLISTshould be reserved to additional modules that need to not be interpreted only for specific runs.- Ship a set of patterns that excludes Elixir standard library by default and most
mix phx.newdependencies, so that debugger boots faster for most users.
- Ship a set of patterns that excludes Elixir standard library by default and most
- Support debugging
.eextemplates- Detect MFAs that refer to template functions in Phoenix view modules derived from
.eextemplate files, to allow stepping through Elixir tags in those templates. - Allow setting breakpoints in
.eexfiles when a.beamfile using the template's relative can be found. This means that the Phoenix view module.beamfile must exist in_buildprior to setting a breakpoint. Run the Run Configuration once, before debugging to complete the build if setting a breakpoint does not work.-
.beamfiles are now indexed by theirLinechunkfilenamessubsection to power this feature.
-
- Detect MFAs that refer to template functions in Phoenix view modules derived from
- Cache
.beamBeamCacheonVirtualFile. Cache is invalidated and refreshed on modification of theVirtualFile. Cache is used for both BEAM Chunks read-only editors andLinechunk file name index.
- Clean up debugger
- #1037 - Each package manager uses a different root path and which directory to pick above the ebins varies by package manager, so document package manager install paths. - @KronicDeth
-
#1041 - @KronicDeth
- Restructure JPS code to remove prefixes and suffixes in class names that redundant with package names.
- Show warnings-as-errors checkbox as original blocker has been fixed for awhile and
ProcessAdapterturns warning text into errors that IDE understands.
-
#1045 - @KronicDeth
- When importing Mix projects, don't exclude compiler output from indexing because it is needed to resolve Elixir Line Breakpoints in EEx files.
- For pre-existing Elixir modules, they will be converted to not exclude compiler output.
- When importing Mix projects, don't exclude compiler output from indexing because it is needed to resolve Elixir Line Breakpoints in EEx files.
-
#1047 - @KronicDeth
- Exclude known uninterpretable modules
Bcrypt.Base:erocksdb:lz4:re2
- Exclude known uninterpretable modules
Bug Fixes
-
#1036 - @KronicDeth
- Turn off
dbeugflag when startingIntelliJElixir.DebugServer, which removes the*DBG*statements that kept printing in the ExUnit output when using the debugger. - Fix conversion of Elixir module names to Erlang module names for
INTELLIJ_ELIXIR_DEBUG_BLACKLISTenvironment variable. - Cache
nullSDKRelease, so that when Elixir is configured, but the Erlang path is broken (such as after abrew unlink erlang, theReleasecalculating usingelixir - Implement
Macro.atomToString - Properly render improper lists
- Show improper list with explicit
|for presenation - Children of improper lists show
headandtailinstead of index.
- Show improper list with explicit
- Show Elixir indices (
0-based) instead of Erlang indices (1-based`) for lists and tuples.
- Turn off
-
#1037 - Loosen check on the path suffix by looking for only
liband notlib/erlang/lib, so that it works for both Homebrew'sebinpaths and ASDF'sebinpaths. - @KronicDeth -
#1041 - @KronicDeth
- Remove unused
MixBuilderbecause building withmixis just an option inElixirBuilder. - Harmonize JPS compile server's invoking of
mixto pattern used in Run Configuration runners.- Use
mixpath from SDK
- Use
- No longer say the build succeeded when there are obvious
mixerrors- Parse
mix compileoutput for compilation errors and warnings- When "warnings-as-errors" is enabled in "Elixir compiler" settings, IDE also shows warnings as errors.
- IDE will know build failed if there are errors (or warnings treated as errors) and properly allow rebuild.
- Parse
- Remove unused
-
#1045 - @KronicDeth
- Group alternatives in
erlang_module_name_patterns_to_regexbefore pinning: I always forget that the|swallows the^and$in regexes. - Reject vs filter accumulation got flipped when switching to
Enum.reduceto track rejections.
- Group alternatives in
-
#1047 - @KronicDeth
- Some modules, like NIF modules, can't be loaded into the debugger. Individual modules not being debuggable shouldn't kill the debugger task, so rescue the known error and record it for later debugging of the debugger.
- Add
:to start of Erlang module names for included debugger excludes
README updates
Debugger
Basics
Excluding Modules
By default, the debugger will scan all the load paths and build path for .beam files and the corresponding modules will be interpreted which causes the Module's Erlang abstract code chunk to be interpreted in Erlang instead of the bytecode chunk being executed in the C parts of the BEAM. This interpretation is much slower than execution, so by default all of the Elixir standard library and the common modules installed in Phoenix projects are excluded from being interpreted when the debugger starts. The modules can be still be stepped into or have breakpoints explicitly set.
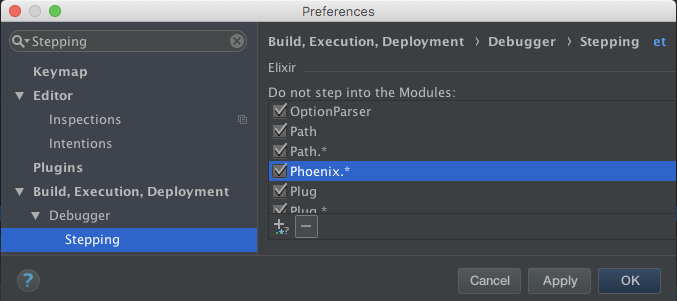
- Preferences > Build, Execution, Deployment > Debugger > Stepping
- Scroll to Elixir
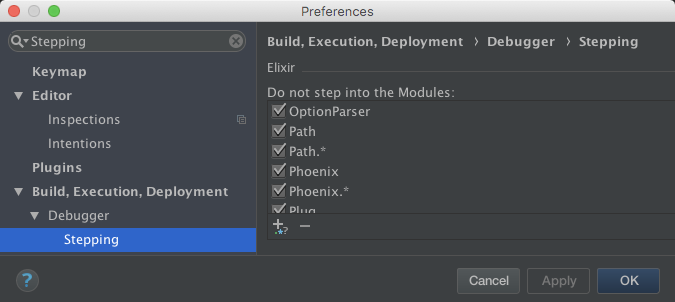
You can customize these module patterns as an application setting.
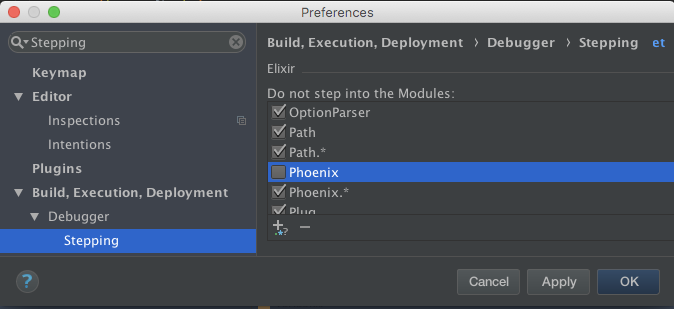
Disabling Existing Module Patterns
- Preferences > Build, Execution, Deployment > Debugger > Stepping
- Scroll to Elixir
- Click the Checkbox next to the pattern you want to disable
- Click Apply to save or OK to save and close Preferences
Editing Existing Module Patterns
- Preferences > Build, Execution, Deployment > Debugger > Stepping
- Scroll to Elixir
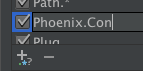
- Click the pattern text box
- Click Apply to save or OK to save and close Preferences
Removing Existing Module Patterns
- Preferences > Build, Execution, Deployment > Debugger > Stepping
- Scroll to Elixir
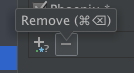
- Click the row of the pattern you want to remove
- Click the "-" Remove button.
- Click Apply to save or OK to save and close Preferences
Adding New Module Patterns
- Preferences > Build, Execution, Deployment > Debugger > Stepping
- Scroll to Elixir
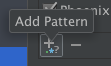
- Click the "+" Add button
- Click the default "*" pattern to edit it
- Click Apply to save or OK to save and close Preferences
Environment Variables
If you want to customize the modules to ignore on a per-Run-Configuration basis, you can set an environment variable in the Run Configuration.
| Variable | Example | Description |
|---|---|---|
| INTELLIJ_ELIXIR_DEBUG_BLACKLIST | iconv,some | Excluding modules from debugger |
Notice: If you want non Elixir. module in blacklist, write it with: :. This rule applies only to module atoms.
Breakpoints
Creating Line Breakpoints
A line breakpoint is a breakpoint assigned to a specific line in the source code.
Line breakpoints can be set on executable lines. Comments, declarations and empty lines are not valid locations for the line breakpoints. Line break points can be set in .ex and .eex files.
.eex line breaks will only work on Elixir code that is used in Phoenix view modules.
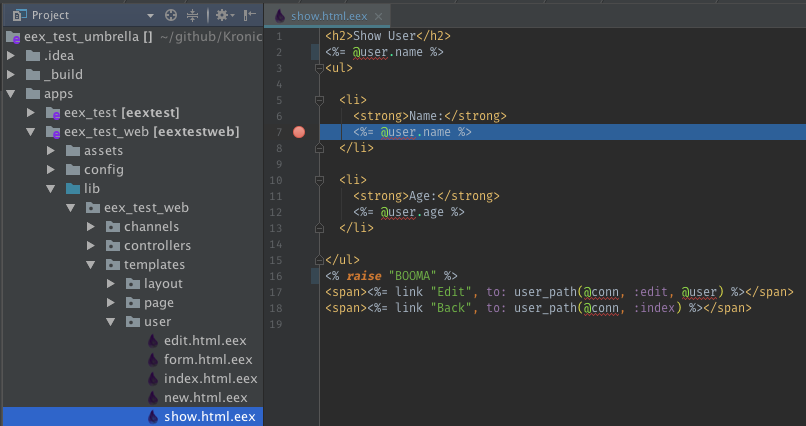
.eex breakpoints only work if a .beam file using the template's relative can be found. This means that the Phoenix view module .beam file must exist in _build prior to setting a breakpoint. Run the Run Configuration once, before debugging to complete the build if setting a breakpoint does not work.
- Place the caret on the desired line of the source code.
- Do one of the following:
- Click the left gutter area at a line where you want to toggle a breakpoint
- Run > Toggle Line Breakpoint
Cmd+F8
Building/Compiling
Settings

- Compile project with mix (use
mix compileinstead ofelixircdirectly) - Attach docs (don't use
--no-docselixircflag) - Attach debug info (don't use
--no-debug-infoelixircflag) - Warnings as errors (use
--warnings-as-errorselixircflag) - Ignore module conflict (use
--ignore-module-conflictelixircflag)
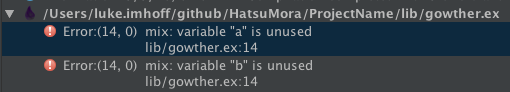
Build Messages
If a file has errors and warnings, they are group together in Build Messages under that file.

Jump To Source
You can jump to errors and warnings in the Build Messages
-
Highlight the error or warning you want to jump to source
-
Do one of the following
-
Right-Click the error or warning
-
Select Jump to Source from the context menu
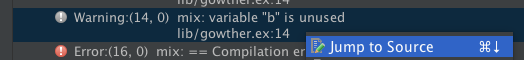
OR
- Click the error or warning
- Press Cmd+Down
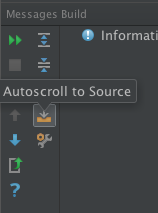
-
You can also turn on Autoscroll to Source, which will Jump To Source whenever you Click or select an error or warning.
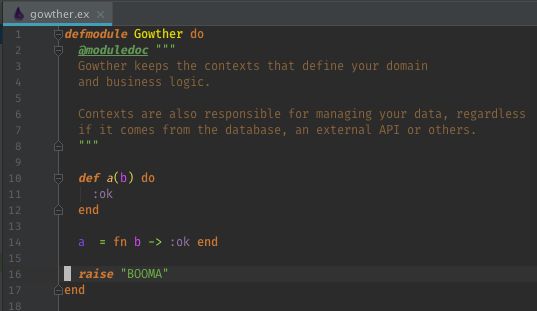
Warnings as Errors

If you enable Warnings as Errors in the settings, then the Warnings will be treated as Errors by elixirc and mix and the Build Messages will show the Warnings as Errors.
If only warnings remain in the source.

With Warnings as Errors On, all the Warnings will appear as Errors and still fail the build

With Warnings as Errors Off, the Warnings will appear as Warnings and the build will succeed

SDK
Package Manager Install Locations
When configuring an SDK, if you don't want to use the suggested SDK home path, you'll need to know where each package manager puts Elixir and Erlang.
If you can can't see hidden files, such as .asdf in your home directory (~), or system directories, such as /usr, you will need to enable Show Hidden Files in the Home Path dialog.
If your dialog looks like this, click the Show Hidden Files button

If you're using the macOS native File Picker, use the keyboard shortcut ⌘⇧. (Command+Shift+Period).
Published by KronicDeth over 6 years ago
Thanks
- For reporting
StreamExis missingnonNullon some IDEs/versions- @runflowcode
- Steve Morin (@smorin)
- IgoR Taskovski (@igortaskovski)
- João Veiga (@jveiga)
- @JohnConnor1969
- Kalpa Vrikcha (@kalpabarbosa)
- 长毛是狗 (@www3838438)
- @VladRose
- Pavel (@birladeanuPavel)
- Dmitry Zakharov (@zakharov-dy)
- Nick Gravel (@nickgravel)
- Carlo Pati (@deemaxx)
- @MortadaAK
Changelog
v7.3.0
Enhancements
-
#988 - @KronicDeth
- Update build matrix
- Update IntelliJ IDEA version
2017.3to2017.3.2 - Update Elixir version
1.5.2to1.5.3
- Update IntelliJ IDEA version
- Update build matrix
-
#1015 - @KronicDeth
- Add supplemental file editor for
.beamfiles: "BEAM Chunks". The decompiled binary file will continue to be shown on the default "Text" editor tab.

The BEAM Chunks editor is subdivided into further tabs, one for each chunk in the.beamfile.

The tabs are listed in the order that the chunks occur in the.beamfile.-
The
Atomchunk holdsLATIN-1atoms whileAtU8holdsUTF8atoms. There will only be one of these atom-related chunks in any given.beamfile.AtU8is used in newer versions of OTP that support UTF8 atoms.The
Atom/AtU8tab shows a table with the columnsColumn Description Source Index Which is 1-based to match Erlang convention. In the Codechunk,atom(0)is reserved to always translate tonilDerived Byte Count The byte count for the atom's bytes Raw Characters From encoding the bytes as LATIN-1 for Atomchunk or UTF-8 forAtU8chunkDerived 
Index 1 is always the module name for the
.beamfile. Since.beamis originally an Erlang format, for Elixir modules, you'll see the full atom name of with theElixir.prefix instead of the Alias name used in Elixir source. -
The
Attrchunk holds the module attributes, but only those that are persisted.The
Attrtab shows a table with the columnsColumn Description Source Key Attribute name Raw Value Attribute value. Note: The value always appears as a list as read from the binary format. I don't know why. Raw 
All modules will have a
:vsnattribute that is either set explicitly or defaults to the MD5 of the module. -
The
CInfchunk is the Compilation Information for the Erlang or Erlang Core compiler. Even Elixir modules have it because Elixir code passes through this part of the Erlang Core compiler.The
CInftab shows a table with the columnsColumn Description Source Key Option name Raw Value Inspected value Raw 
-
The
Codechunk contains the byte code for the module. It is encoded in BEAM Compact Term Encoding, which differs from the binary format produced byterm_to_binary.The
Codetab shows a read-only editor with one byte code operation on each line. For ease of reading, operations are grouped by function and then label block with indentation indicating scope.
By default as many references to other chunks and references to other parts of
Codechunk are inlined to ease understanding. If you want to see the raw byte code operations, you can turn off the various inliners. -
The
Dbgichunk contains Debug Info. It was introduced in OTP 20 as a replacement for theAbstchunk. While theAbstchunk was required to contain the Erlang AST, theDbgiformat can contain the debug info for other languages, such as Elixirquotedform AST.Because the format is language neutral, the format is a set of nested, versioned formats. The outer most layer is
{:debug_info_v1, backend, metadata | :none}For
:debug_info_v1, Elixir'sbackendis:elixir_erl. Themetadatafor:elixir_erlis further versioned:{:elixir_v1, map, specs}.mapcontains the bulk of the data.Key Value :attributesAttributes similar to the Attrchunk, but at the Elixir, instead of Core Erlang level. Usually they match with the exception thatattributesdoesn't containvsnwhenAttrcontains theMD5version:compile_optsCompilation options similar to CInfchunk'soptionskey, but at for Elixir, instead of Core Erlang level.:definitionsThe Elixir quotedAST for reach function clause.:fileThe name of the file the module was generated from. :lineThe line in :filewhere the module was defined, such as the linedefmoduleoccurred.:moduleThe name of the module as an atom:unreachableUnreachable functions The
Dbgitag show the single value map entries::file,:line, and:module
For the multi-value keys:
:attributes,:compile_opts, and:definitions, there are individual tabs.
The Attributes tab has the same format as the
Attrs chunk
The Compile Options tab is usually empty, much like the
CInfoptionskey for Erlang.
The Definitions tab is split between a tree of Module, Function/Arity and clauses.

Clicking on a clause will show only that clause, but clicking on a higher level in the tree will show all clauses in the function or the entire Module.


The AST stored in the
definitionstab and the process of converting it back to code is not format preserves, so it will not look precisely like the source code as the AST has undergone some macro expansion before its put in the Dbgi chunk. As common idioms are understood, reversals will be add to the renderer. -
The
ExDcchunk stores ExDoc. Not the rendered HTML from theex_docpackage, but the the@doc,@moduledoc, and@typedocattribute values that work even withoutex_docinstalled. This chunk is what is consulted when thehhelper is used iniex.The
ExDcbinary format is fromterm_to_binary, so it can be reversed withbinary_to_term. The term format is a versioned as{version, versioned_format}. The currentversiontag is:elixir_docs_v1and theversioned_formatis a Keyword.t with:callback_docs,:docs,:moduledoc, and:type_docskeys.Like
Dbgi, theExDctab is split between a tree to navigate and an editor to show the decompiled value.

Node Description Root All docs Module @moduledocTypes All @typedocsTypes child A specific @typedocCallbacks All @callback@docsCallbacks child A specific @callback's@docFunctions/Macros All @docs for functions/macrosFunctions/Macros child A specific function/macro's @doc -
The
ExpTchunk is the Export Table. The name "Export" derives from theErlangmodule attribute-export, which is used to "export" functions from a module. It is the equivalent of making a function or macro public withdefanddefmacroas opposed to making it private withdefpanddefmacropin Elixir.The
ExpTtab shows a table with the columnsColumn Description Source Atom Index Index into the AtomorAtU8chunk for the function's nameRaw Name The atom referenced by "Atom Index" Derived Arity The arity (argument count) of the function Raw Label Label index in the Codechunk where the function is defined. This label is usually immediately after thefunc_infooperation and before the first pattern match or guard operation.Raw 
You'll notice the first entry starts with
MACRO-. This is because the BEAM, being made for Erlang has no concept of macros. It only understands functions, so Elixir macros, like__using__/1called byuseare compiled to plain Erlang functions withMACRO-prefixed to their name and an extra argument (the__CALLER__environment) as the first argument, which increases the arity, yielding a full MFA ofMACRO-__using__/2as seen above. -
The
ImpTchunk is the Import Table. It DOES NOT encode just the Erlang-importattributes or Elixirimportmacro calls: it tracks any external function or macro called from another module.call_ext_*operations in theCodechunk don't store the Module and Function (MF) of the function they will call directly in the bytecode, instead, one of the arguments is an index into theImpTchunk. This way, all external calls are normalized into theImpTchunk instead of being denormalized to the call site. The arity still appears at the call site to help with checking the argument count.The
ImpTtab shows a table with the columnsColumn Description Source Index 0-based index used by references in the Codechunk.Derived Module Atom Index Index into the AtomorAtU8chunk for the Module's nameRaw Module Atom The atom referenced by "Module Atom Index". Derived Function Atom Index Index into the AtomorAtU8chunk for the functon's nameRaw Function Atom The atom referened by "Function Atom Index". Derived 
You may notice that
erlang.byte_size/1is included in the table. This is because even bifs are referenced by MFA and not a pre-assigned number as would be the case for system calls in operating systems like Linux. BEAM is like an Operation System, but not in all ways. -
The
LitTchunk contains literals loaded as arguments inCodechunk. Confusingly, in theCodechunk sometimes theliteral(N)term is used to encode integerN, an index into another chunk, or an actualindexinto theLitT. Howliteralterms are handled is completely dependent on the specific operation, so without having outside knowledge about the bytecode operation arguments for BEAM, the best way to figure out ifliteralterms are an integer or an index is to toggle the various controls in theCodetab to see ifliteralwith no inlining turns into aLitTliteral,FunTfunction reference,ImpTfunction reference, or integer.The
LitTtab shows a table with the columnsColumn Description Source # 0-based index used by references in the Codechunk.Derived Term The equivalent of `raw > binary_to_term() 
-
The
LocTchunk is the dual to theExpTchunk: it contains all private functions and macros.The
LocTtab shows a table with the columnsColumn Description Source Atom Index Index into the AtomorAtU8chunk for the function's nameRaw Name The atom referenced by "Atom Index" Derived Arity The arity (argument count) of the function Raw Label Label index in the Codechunk where the function is defined. This label is usually immediately after thefunc_infooperation and before the first pattern match or guard operation.Raw 
You'll notice the first entry
-__struct__/1-fun-0-, starts with-and have a/suffix withfunin it. This naming scheme is used for anonymous functions such as those defined withfnor the capture operator (&) in Elixir. Much like how macros don't really exist and use aMACRO-suffix, anonymous functions/lambdas don't exist, and instead use a distinct naming scheme-<PARENT_FUNCTION>/*fun*. UnlikeMACRO-, which is an Elixir invention, anonymous functions/lambdas really being local named functions with derived names is also done in pure Erlang modules. Erlang's anonymous functions are defined withfun, which is where thefunpart of the naming scheme comes from. -
The
StrTchunk contains a single contiguous pool of all Erlang strings (that is, Elixir charlists) used in theCodechunk. These strings are used for byte code operations likebs_put_string. Not all strings appear inStrT. Some strings, including most Elixir strings (Erlang binaries) appear in theLitTchunk that holds literals.
The
StrTis contiguous with no separation of strings. Instead of encoding the start and length of each string in the chunk itself, the start and length for any given string is passed as arguments to the byte code operations in theCodechunk. By doing this, shared substrings can be efficiently encoded inStrT.
-
- Add supplemental file editor for
-
#1021 - @KronicDeth
-
Support for https://github.com/elixir-lang/elixir/commit/23c7542d95683a497a7b93071b9ccbbeb9e45d2f
Version Struct Started Event Finished Event %ExUnit.Test{}field< 1.6.0 %ExUnit.TestCase{}:case_started:case_finishedcase>= 1.6.0 %ExUnit.TestCase{}:module_started:module_finishedmoduleBecause Elixir 1.6.0 could not introduce a breaking change, the
< 1.6.0events are fired, butresources/exunit/1.6.0/team_city_ex_unit_formatting.exwill ignore them and only convert the>= 1.6.0events to TeamCity event used in the JetBrains Test Runner UI.
-
- #1018 - Expose Declarations > Functions and Declarations > Macros in Color Settings - @dimcha
Bug Fixes
-
#1019 - Don't use
StreamExbecause support is inconsistent across IDEs - @KronicDeth -
#999 - @ronanboiteau
- Jetbrains' Gogland is now named GoLand, updated README accordingly
- In donors list, Garrett Hart had his GitHub URL (
@https://github.com/thirdshift) shown instead of his GitHub username (@thirdshift)
README.md Updates
.beam Files
.beam files are the compiled version of modules on the BEAM virtual machine used by Elixir and Erlang. They are the equivalent of .class files in Java.
.beam files are not detected purely by their file extension: the BEAM file format starts with a magic number, FOR1, that is checked for before decompiling.
.beam files have 2 editors registered: decompiled Text and BEAM Chunks

Decompression
If the .beam module was compiled with the compressed compiler directive, which in Erlang looks like
-compile([compressed])
and in Elixir looks like
@compile [:compressed]
then the outer file format is GZip (which is detected by checking for the gzip magic number, 1f 8b, at the start of the file) and the .beam will be (stream) decompressed before the .beam header is checked and the chunks decoded.
BEAM Chunks
.beam files are composed of binary chunks. Each chunk is formatted
This format is generically referred to as Type-Length-Value
The BEAM Chunks editor tab is subdivided into further tabs, one for each chunk in the .beam file.

The tabs are listed in the order that the chunks occur in the .beam file.
Atom / AtU8
The Atom chunk holds LATIN-1 encoded atoms while AtU8 chunk holds UTF-8 atoms. There will only be one of these atom-related chunks in any given .beam file. AtU8 is used in newer versions of OTP that support UTF-8 atoms. AtU8 was introduced in OTP 20.
Format
Tab
The Atom/AtU8 tab shows a table with the columns
| Column | Description | Source |
|---|---|---|
| Index | 1-based to match Erlang convention. In the Code chunk, atom(0) is reserved to always translate to nil
|
Derived |
| Byte Count | The byte count for the atom's bytes | Raw |
| Characters | From encoding the bytes as LATIN-1 for Atom chunk or UTF-8 for AtU8 chunk |
Derived |

Attr
The Attr chunk holds the module attributes, but only those that are persisted. Erlang module attributes are persisted by default, but in Elixir module attributes need to be marked as persisted with Module.register_attribute/3
Format
The Attr chunk uses External Term Format (term_to_binary's output) to encode a proplist, which is similar to, but not quite the same an Elixir Keyword list
All modules will have a :vsn attribute that is either set explicitly or defaults to the MD5 of the module.
Tab
The Attr tab shows a table with the columns
| Column | Description | Source |
|---|---|---|
| Key | Attribute name | Raw |
| Value | Attribute value. Note: The value always appears as a list as read from the binary format. I don't know why. | Raw |

CInf
The CInf chunk is the Compilation Information for the Erlang or Erlang Core compiler. Even Elixir modules have it because Elixir code passes through this part of the Erlang Core compiler
Format
The CInf chunk uses External Term Format (term_to_binary's output) to encode a proplist, which is similar to, but not quite the same an Elixir Keyword list
Tab
The CInf tab shows a table with the columns
| Column | Description | Source |
|---|---|---|
| Key | Option name | Raw |
| Value | Inspected value | Raw |

Code
The Code chunk contains the byte code for the module.
Format
It is encoded in BEAM Compact Term Encoding, which differs from the binary format produced by term_to_binary.
Tab
The Code tab shows a read-only editor with one byte code operation on each line. For ease of reading, operations are grouped by function and then label block with indentation indicating scope.

By default as many references to other chunks and references to other parts of Code chunk are inlined to ease understanding. If you want to see the raw byte code operations, you can turn off the various inliners.
####### Controls
If any of the inliners are incorrect or you have an argument name that makes more sense, please open an issue.
Dbgi
The Dbgi chunk contains Debug Info. It was introduced in OTP 20 as a replacement for the Abst chunk. While the Abst chunk was required to contain the Erlang AST, the Dbgi format can contain the debug info for other languages, such as Elixir quoted form AST.
Format
Because the format is language neutral, the format is a set of nested, versioned formats. The outer most layer is
{:debug_info_v1, backend, metadata | :none}
For :debug_info_v1, Elixir's backend is :elixir_erl. The metadata for :elixir_erl is further versioned: {:elixir_v1, map, specs}.
map contains the bulk of the data.
| Key | Value |
|---|---|
:attributes |
Attributes similar to the Attr chunk, but at the Elixir, instead of Core Erlang level. Usually they match with the exception that attributes doesn't contain vsn when Attr contains the MD5 version |
:compile_opts |
Compilation options similar to CInf chunk's options key, but at for Elixir, instead of Core Erlang level. |
:definitions |
The Elixir quoted AST for reach function clause. |
:file |
The name of the file the module was generated from. |
:line |
The line in :file where the module was defined, such as the line defmodule occurred. |
:module |
The name of the module as an atom
|
:unreachable |
Unreachable functions |
Tab
The Dbgi tag show the single value map entries: :file, :line, and :module.

For the multi-value keys: :attributes, :compile_opts, and :definitions, there are individual tabs.

####### Attributes
The Attributes tab has the same format as the Attrs chunk.

####### Compile Options
The Compile Options tab is usually empty, much like the CInf options key for Erlang.

####### Definitions
The Definitions tab is split between a tree of Module, Function/Arity and clauses.

Clicking on a clause will show only that clause, but clicking on a higher level in the tree will show all clauses in the function or the entire Module.


The AST stored in the definitions tab and the process of converting it back to code is not format preserves, so it will not look precisely like the source code as the AST has undergone some macro expansion before its put in the Dbgi chunk. As common idioms are understood, reversals will be add to the renderer.
ExDc
The ExDc chunk stores ExDoc. Not the rendered HTML from the ex_doc package, but the the @doc, @moduledoc, and @typedoc attribute values that work even without ex_doc installed. This chunk is what is consulted when the h helper is used in iex.
Format
The ExDc chunk is the encoded with term_to_binary. The term format is a versioned as {version, versioned_format}. The current version tag is :elixir_docs_v1 and the versioned_format is a Keyword.t with keys matching the Code.get_docs/2 tags :callback_docs, :docs, :moduledoc, and :type_docs keys.
Tab
Like Dbgi, the ExDc tab is split between a tree to navigate and an editor to show the decompiled value.


Click on a node in the tree will show all docs at that level and any descendants.
| Node | Description |
|---|---|
| Root | All docs |
| Module | @moduledoc |
| Types | All @typedocs |
| Types child | A specific @typedoc
|
| Callbacks | All @callback @docs |
| Callbacks child | A specific @callback's @doc
|
| Functions/Macros | All @docs for functions/macros |
| Functions/Macros child | A specific function/macro's @doc
|
ExpT
The ExpT chunk is the Export Table. The name "Export" derives from the Erlang module attribute -export, which is used to "export" functions from a module. It is the equivalent of making a function or macro public with def and defmacro as opposed to making it private with defp and defmacrop in Elixir.
Format
The BEAM format and the ExpT chunk, being made for Erlang, has no concept of macros. It only understands functions, so Elixir macros, like __using__/1 called by use are compiled to plain Erlang functions with MACRO- prefixed to their name and an extra argument (the __CALLER__ environment) as the first argument, which increases the arity, yielding a full MFA of MACRO-__using__/2 as seen above.
Tab
The ExpT tab shows a table with the columns
| Column | Description | Source |
|---|---|---|
| Atom Index | Index into the Atom or AtU8 chunk for the function's name |
Raw |
| Name | The atom referenced by "Atom Index" | Derived |
| Arity | The arity (argument count) of the function | Raw |
| Label | Label index in the Code chunk where the function is defined. This label is usually immediately after the func_info operation and before the first pattern match or guard operation. |
Raw |

ImpT
The ImpT chunk is the Import Table. It DOES NOT encode just the Erlang -import attributes or Elixir import macro calls: it tracks any external function or macro called from another module. call_ext_* operations in the Code chunk don't store the Module and Function (MF) of the function they will call directly in the bytecode, instead, one of the arguments is an index into the ImpT chunk. This way, all external calls are normalized into the ImpT chunk instead of being denormalized to the call site. The arity still appears at the call site to help with checking the argument count.
Format
You may notice that erlang.byte_size/1 is included in the table. This is because even BIFs are referenced by MFA and not a pre-assigned number as would be the case for system calls in operating systems like Linux. BEAM is like an Operation System, but not in all ways.
Tab
The ImpT tab shows a table with the columns
| Column | Description | Source |
|---|---|---|
| Index | 0-based index used by references in the Code chunk. |
Derived |
| Module Atom Index | Index into the Atom or AtU8 chunk for the Module's name |
Raw |
| Module Atom | The atom referenced by "Module Atom Index". | Derived |
| Function Atom Index | Index into the Atom or AtU8 chunk for the functon's name |
Raw |
| Function Atom | The atom referened by "Function Atom Index". | Derived |

LitT
The LitT chunk contains literals loaded as arguments in Code chunk.
Format
Confusingly, in the Code chunk sometimes the literal(N) term is used to encode integer N, an index into another chunk, or an actual index into the LitT. How literal terms are handled is completely dependent on the specific operation, so without having outside knowledge about the bytecode operation arguments for BEAM, the best way to figure out if literal terms are an integer or an index is to toggle the various controls in the Code tab to see if literal with no inlining turns into a LitT literal, FunT function reference, ImpT function reference, or integer.
Tab
The LitT tab shows a table with the columns
| Column | Description | Source |
|---|---|---|
| # | 0-based index used by references in the Code chunk. |
Derived |
| Term | The equivalent of `raw | > binary_to_term() |

Line
The Line chunk encodes both the file name and line number for each line(literal(n)) operation in the Code chunk. The n in line(literal(n)) is an index in to the Line References table in the Line chunk. This is used in Phoenix view modules to show where code from templates comes from.
Format
The Line chunk is composed of 2 subsections: (1) Line References and (2) File Names. First there is a header setting up the number of each entry to expect.
####### Line References
This uses the Compact Term Format used for the Code chunk. The format ends up producing {file_name_index, line} pairs using the following algorithm:
| Term | Interpretation |
|---|---|
atom(n) |
Change file_name_index to n
|
integer(n) |
Add {file_name_index, n} to end of Line References |
####### File Names
Tab
The Line tab has one subtab for each subsection in the tab. Each subsection has its own table.


LocT
The LocT chunk is the dual to the ExpT chunk: it contains all private functions and macros.
Format
You'll notice entries like -__struct__/1-fun-0-, starts with - and have a / suffix with fun in it. This naming scheme is used for anonymous functions such as those defined with fn or the capture operator (&) in Elixir. Much like how macros don't really exist and use a MACRO- suffix, anonymous functions/lambdas don't exist, and instead use a distinct naming scheme -<PARENT_FUNCTION>/*fun*. Unlike MACRO-, which is an Elixir invention, anonymous functions/lambdas really being local named functions with derived names is also done in pure Erlang modules. Erlang's anonymous functions are defined with fun, which is where the fun part of the naming scheme comes from.
Tab
The LocT tab shows a table with the columns
| Column | Description | Source |
|---|---|---|
| Atom Index | Index into the Atom or AtU8 chunk for the function's name |
Raw |
| Name | The atom referenced by "Atom Index" | Derived |
| Arity | The arity (argument count) of the function | Raw |
| Label | Label index in the Code chunk where the function is defined. This label is usually immediately after the func_info operation and before the first pattern match or guard operation. |
Raw |

StrT
The StrT chunk contains all Erlang strings (that is, Elixir charlists) used in the Code chunk.
Format
The StrT chunk contains a single contiguous pool. These strings are used for byte code operations like bs_put_string. Not all strings appear in StrT. Some strings, including most Elixir strings (Erlang binaries) appear in the LitT chunk that holds literals. I'm not sure how the compiler determines whether to use StrT or LitT. I think it all depends on the byte code operation.
Instead of encoding the start and length of each string in the chunk itself, the start and length for any given string is passed as arguments to the byte code operations in the Code chunk. By doing this, shared substrings can be efficiently encoded in StrT.
Tab

Published by KronicDeth almost 7 years ago
Thanks
- For reporting that
.batwas no longer needed on WIndows- Huabin Zhang (@zhanghuabin)
- For reporting that Credo annotator broke on Elixir scratch files
- Andrei Dziahel (@develop7)
- For reporting that another read action wrapper was needed in the Mix project importer
- Doston Turgunov (@doston9471)
- For reporting
ExternalLanguageAnnotators.allForFilewas being called with anullPsiFile- Sławomir Stec (@stokilo)
- For reporting the Credo annotator, in certain projects, severely slows down the responsiveness of the editor.
- Bartosz Nowak (@sztosz)
- Joseph Miller (@joffotron)
- Benjamin Piouffle (@Betree)
- Thomas Schmidleithner (@tschmidleithner)
- Georgy (@gazoon)
- Josh Taylor (@joshuataylor)
- For pairing with me to demonstrate the responsiveness problems
- Yordis Prieto (@yordis)
- Phillipp Ohlandt (@phillippohlandt)
- For reporting that configuring Erlang SDK for Elixir SDK failed when more than
CLASSESandSOURCESRoot Types are installed- Valentin Nazarov (@kozlice)
Changelog
v7.2.1
Bug Fixes
-
#980 - Use
documentionRootTypeto indirectly get the documentationOrderRootTypein the Erlang SDK Type, so that it works in Small IDEs that have more thanCLASSESandSOURCESroot types installed. - @KronicDeth -
#981 - @KronicDeth
-
The
credoannotator is disabled by default as numerous users find runningmix credoin the background has a negative impact on their system performance. If you like to try enabling the annotation, you can turn it on using the configuration.- Preferences > Editor > Inspections > Elixir
- Check "Credo"
- Click OK to save and close Preferences
If you notice a degradation the in the responsiveness of the editor, it is recommended you disable the annotator again.
- Preferences > Editor > Inspections > Elixir
- Uncheck "Credo"
- Click OK to save and close Preferences
-
-
#982 - Protect from
PsiFilebeingnullinLocalcredo inspector - @KronicDeth -
#983 - Run
Qualified#moduleNamegetTextin Read Action. - @KronicDeth -
#985 - Scratch Files have a
Project, but not aModule, so change flow to useProjectwhenModuleisnullin credo annotator. - @KronicDeth -
#986 - Don't add
.battomixon Windows.mixis never run as an executable. It is either run as a script toelixir.batOR as an argument toerl.exewhenerl.exeis runningelixir. - @KronicDeth
README Updates
Credo
Annotator
When enabled, if credo is not installed as a project dependency, nothing will happen, but if it is installed, mix credo PATH will be called on any files after updates have quieted. Any credo check failures will show up as warning annotations

Individual check failures will show the explanation (from mix credo PATH:LINE(:COLUMN)) if you hover over the annotation

You can hover over the explanation and click the embedded links to jump to the line (and column) where the failure occurred.
Enable
The credo annotator is disabled by default as numerous users find running mix credo in the background has a negative impact on their system performance. If you like to try enabling the annotation, you can turn it on using the configuration.
- Preferences > Editor > Inspections > Elixir
- Check "Credo"
Disable
If you notice a degradation the in the responsiveness of the editor, it is recommended you disable the annotator again.
- Preferences > Editor > Inspections > Elixir
- Uncheck "Credo"
Published by KronicDeth almost 7 years ago
Thanks
- For reporting that
OrderRootType.getOrderRootTypenow has a@NotNullannotation, which causes newer Small IDE releases to break when trying to accessJavaDocRootType.getInstance().- Vladimir Guguiev (@wzrdzl)
- Nitin Gupta (@nitingupta910)
- For reporting "invokeAndWait from read-action leads to possible deadlock" warning
- Josh Taylor (@joshuataylor)
Changelog
v7.2.0
Enhancements
-
#963 -
mixruns will be faster as they will no longer check to see if the SDK is updated. - @KronicDeth
Bug Fixes
- #963 - Avoid problems with read and write locks when updating Elixir SDK on-demand by instead updating them when any project is open using a project converter. - @KronicDeth
-
#964 - JetBrains/intellij-community@9adbba0 added
@NotNulltoOrderRootType.getOrderRootType, whichJavaDocRootType.getInstancecalls, which means any Small IDE usingintellij-communitysince 4 months ago, including the newest CLion cannot haveJavadocOrderRootType.getInstancesafely called. - @KronicDeth -
#966 - Path changes were not being written back to disk because the
projectSdksModel.apply()was being called before theeditor.apply(), which would have copied to theeditor's path changes to theprojectSdksModel. - @KronicDeth
Published by KronicDeth almost 7 years ago
Changelog
v7.1.0
Enhancements
-
#955 - @KronicDeth
- Start using Kotlin for new development.
- Elixir Facet in Small IDEs
- Preferences > Languages & Frameworks > Elixir can set the Elixir Facet SDK for the Project Module used in Small IDEs as a per-project settings.
- Preferences > Languages & Frameworks > Elixir> SDKs can add, delete, and configure Elixir SDKs as per-application settings.
- Preferences > Languages * Frameworks > Elixir > Internal SDKs can add, delete, and configure Erlang SDK for Elixir SDKs as per-application settings.
- Configure SDK before running
mixwhen importing mix projects, so that themixpath does not need to be configured separately from the SDK path.- The
mixpath no longer needs to be setup independently from the Elixir SDK.
- The
-
#957 - Add Local shared
credoinspection, so the thecredoinspection works for Code > Code Cleanup. - @KronicDeth -
#958 - @KronicDeth
-
Show Mix ExUnit in context menu in Elixir Facets, so that
- Run 'Mix ExUnit ...'
- Debug 'Mix ExUnit ...'
- "Create "Mix ExUnit ...'"
appear in Rubymine when you right-click the
testdirectory and it is Marked as a Test Sources Root. It will appear green in Rubymine if already marked. To mark it, do the following:- Right-Click
testdirectory - Select "Mark Directory as > Test Sources Root"
-
Bug Fixes
-
#955 - @KronicDeth
- Protect access to
JavadocOrderRootType.getInstance()so that it doesn't cause an error in Small IDEs where its Extension Point is not defined. - If the explanation tooltip is empty, fallback to the message for the credo annotator instead.
- Protect access to
-
#956 - Check if
SdkAdditionalDataisnullbefore gettingErlangSDKas it can benullin certain scenarios in Rubymine. - @KronicDeth -
#958 - @KronicDeth
FixisConfigurationFromContext, so that it works on Mix ExUnit Run Configurations generated from directories. Check if theprogramParametersandworkingDirectorymatch by just
generating another configuration from the context as this ensures the logic matches and includes support forPsiDirectory.
README Updates
From Existing Sources
Import project from external model
If you've already created a mix project, you can load it as an Elixir project into the plugin.
- File > New > Project From Existing Sources...
- Select the root directory of your project.
- Select "Import project from external model"
- Select Mix

- Click Next
- Select a Project SDK directory by clicking Configure.
- The plugin will automatically find the newest version of Elixir installed. (NOTE: SDK detection only works for
Linux, homebrew installs on OSX, and Windows. Open an issue
with information about Elixir install locations on your operating system and package manager to have SDK detection
added for it.) - If the automatic detection doesn't find your Elixir SDK or you want to use an older version, manually select select
the directory above thebindirectory containingelixir,elixirc,iex, andmix. (On Windows it is the
directory containingelixir.bat,elixirc.bat,iex.bat, andmix.bat.) - Click Finish after you select SDK name from the Project SDK list.
- The "Mix project root" will be filled in with the selected directory.
- (Optional) Uncheck "Fetch dependencies with mix" if you don't want to run
mix deps.getwhen importing the project
- If "Fetch dependencies with mix" is checked both
mix local.hex --forceandmix deps.getwill be run.
- Click Next
- All directories with
mix.exsfiles will be selected as "Mix projects to import". To import just the main project and not its dependencies, click Unselect All. - Check the box next to the project root to use only its
mix.exs. (It will likely be the first checkbox at the top.) - Click Finish
SDK
Because Elixir is built on top of Erlang, Elixir command line commands don't have OS native binaries, instead the OS native binaries from Erlang are used. In order to reliably find the Erlang OS native binaries, like erl and erl.exe, the path to BOTH the Erlang SDK and the Elixir SDK must be configured. This allows you to install Erlang and Elixir with completely different package managers too: you can install Erlang with kerl and Elixir with kiex and you don't have to worry about IntelliJ not seeing the environment variables set by kerl when launching IntelliJ from an application launchers instead of a terminal.
Since JetBrains' OpenAPI only supports one SDK per Project or Module, to support Elixir and Erlang SDK at the same time, the Elixir SDK keeps track of an Internal Erlang SDK. When setting up your first Elixir SDK, you will be prompted to create an Erlang SDK (if you have the intellij-erlang plugin installed) or and Erlang for Elixir SDK (if you don't have intellij-erlang installed and you need to use the minimal Erlang for Elixir SDK supplied by this plugin).
Rich IDEs
Rich IDEs can use the Project Structure system to configure Elixir and Erlang SDKs and select the Project/Module SDK.
...
Small IDEs
Because Small IDEs like Rubymine do not have Project Structure, the Elixir SDK, Erlang SDK, and selected SDK must be configured in Preferences.
Elixir Facet SDK
Facets are a feature of JetBrains OpenAPI that allow additional languages and frameworks to be added to a Module. In Small IDEs, each Project has only one Module and its SDK MUST match the Small IDE's language, such as a Ruby SDK in Rubymine, so to allow an Elixir SDK to be selected, an Elixir Facet is added to the Module in Small IDEs.
To configure the Elixir Facet SDK
- Open Preferences > Languages & Frameworks > Elixir
- Select a previously created Elixir SDK from the SDK combo box.
- If there is no Elixir SDK, you can create one first.
- Click Apply to save the Preferences changes or OK to save and close.
Elixir SDKs
In Small IDEs, Elixir SDKs are tracked as Application Preferences, so any Elixir SDK you create in one project will be usable in another and you won't have to create the SDK in each project, just select it.
-
Open Preferences > Languages & Frameworks > Elixir > SDKs
-
Click
+to add a new Elixir SDK
-
If you don't already have an Erlang SDK for Elixir SDK setup, you'll need to create one first.

-
You'll be prompted with the default path for the most recent version of Erlang installed.

You can change directory to a select a different version. The home directory for "Erlang SDK for Elixir SDK" for Homebrew is NOT
/usr/local/Cellar/erlang/VERSION, but/usr/local/Cellar/erlang/VERSION/lib/erlangdue to where the OTP appebindirectories are located. -
Click OK to create the Erlang SDK for Elixir SDK.
-
With at least one Erlang SDK for Elixir SDK setup, you'll be prompted with the default path for the most recent version of Elixir installed.

-
Click OK to create the Elixir SDK.
-
Click Apply to save the Preferences changes or OK to save and close.
You can further customize the Elixir SDK by selecting its name from the left list.

- Change Home Path
- Change Internal Erlang SDK
- Change
ebindirectories on the Classpath tab
Internal Erlang SDK
If you want to change the Internal Erlang SDK, you'll need to create a new Erlang SDK for Elixir SDK.
-
Open Preferences > Languages & Frameworks > Elixir > Internal SDKs

-
Follow the same steps as above to create an SDK
Published by KronicDeth almost 7 years ago
Thanks
- For reporting that
mix credospiking the CPU can make IntelliJ appear sluggish while its usingmix credofor annotations. - For explaining how to properly switch invalidate the parsed files when the Elixir level changes when the SDK changes
- Dennis Ushakov (@denofevil)
Changelog
v7.0.0
Enhancements
-
#944 - @KronicDeth
- Eliminate the majority of the
eolStarparser rules around operators where they do not matter leaving only theeolStarafterCOMMAand the the ones that help differentiate unary and binary+/-. This simplifies the parser and under certain conditions should prevent reparsing when onlyWHITE_SPACEchanges in size.- Look-ahead in the lexer, where it's cheaper than the parser to see if the next token does not care if there's an
EOLor normalWHITE_SPACE. - After operators that don't care if they are followed by
EOL, try to match all followingWHITE_SPACE,ESCAPED_EOLandEOL.
- Look-ahead in the lexer, where it's cheaper than the parser to see if the next token does not care if there's an
- Eliminate the majority of the
-
#950 - @KronicDeth
-
If you want to limit the performance impact of the credo annotator because
mix credospikes your CPU, you can limit the number ofmix credoruns to 1 per open file by disabling the Explanation tooltip- Preferences > Editor > Inspections > Credo
- Uncheck "Include Explanation"
If you don't want the annotator to run at all on open editors, then you can disable the paired
inspection- Preferences > Editor > Inspections
- Uncheck Elixir > Credo
If you've unchecked the inspection, it disables both the annotation and the pair inspection when Analyze > Inspect Code... is run. You can still run the Credo inspection by name.
- Analyze > Run Inspection By Name... (⌥⇧⌘I)
- Type "Credo"
- Select "Credo" from the shortened list
- Hit Enter.
You'll be presented with a "Run 'Credo'" dialog
- Change the "Inspection scope" from "Whole project", which would include the
depsto "Custom scope" - Select "Project Production Files" from the "Custom scope" dropdown
- Click "OK"
-
-
#951 - @KronicDeth
- Setup
VirtualFilePointerManagerduringParsingTestCase - Put
LineMarkerInfoon leaf elements for Method (Call Definition) Separators for a performance improvement. - Add IntelliJ IDEA 2017.3 to the build matrix
- Setup
Bug Fixes
-
#947 - When the SDK changes, record what
Releaseof Elixir is used indirectly, using aLevelenumthat only cares about the major and minor version. Changing theLevel, will mark the open files and .beam files as invalidated, so that if the SDK is changed, the stubs and codeLevelwill agree, so there isn't a stub incompatibility with the PSI. - @KronicDeth - #950 - Allow credo section to be empty when processing credo explanations - @KronicDeth
-
#951 - @KronicDeth
- Prevent negative indent, not supported in 2017.3
- Cleanup SDKs from MixProjectImportBuilderTest
Incompatible Changes
- #951 - Drop support for IntelliJ IDEA before 2016.3 - @KronicDeth
README Updates
Credo
Annotator
If credo is not installed as a project dependency, nothing will happen, but if it is installed, mix credo PATH will be called on any files after updates have quieted. Any credo check failures will show up as warning annotations

Individual check failures will show the explanation (from mix credo PATH:LINE(:COLUMN)) if you hover over the annotation

You can hover over the explanation and click the embedded links to jump to the line (and column) where the failure occurred.
Inspection
Batch Mode
If you'd like to run the mix credo external annotator when it is disabled, you can run it using the inspection name.
- Analyze > Run Inspection By Name... (⌥⇧⌘I)
- Type "Credo"
- Select "Credo" from the shortened list
- Hit Enter.
You'll be presented with a "Run 'Credo'" dialog
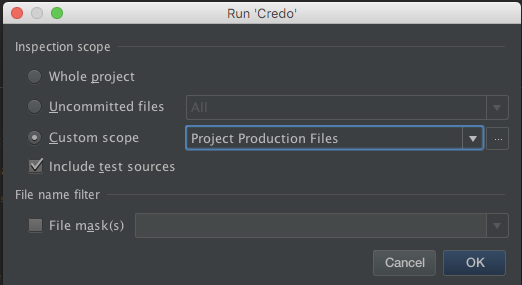
- Change the "Inspection scope" from "Whole project", which would include the
depsto "Custom scope" - Select "Project Production Files" from the "Custom scope" dropdown
- Click "OK"
The Inspections Result Tool Pane will open and show results as each file is processed.
-
Click the ▶ to expand the Credo section to show all warnings

-
Click an entry for the details of an individual warning with a code highlighting.
The view will show the parts of the file that aren't annotated as collapsed with the discontinuous line number indicating the jumps.
If you click on + collapse markers, you can expand the collapsed sections to see the full context

Or you can hover over the collapsed section to see a tooltip preview of the expansion
Configuration
If you want to limit the performance impact of the credo annotator because mix credo spikes your CPU, you can limit the number of mix credo runs to 1 per open file by disabling the Explanation tooltip
- Preferences > Editor > Inspections > Credo
- Uncheck "Include Explanation"
If you don't want the annotator to run at all on open editors, then you can disable the paired inspection
- Preferences > Editor > Inspections
- Uncheck Elixir > Credo
Once the annotator is disabled, you can still run the inspection in batch mode