
netdata
The open-source observability platform everyone needs!
GPL-3.0 License
Bot releases are visible (Hide)
Published by netdatabot about 5 years ago
Netdata v1.17.1
Release v1.17.1 contains 2 bug fixes, 6 improvements, and 2 documentation updates.
At a glance
The main reason for the patch release is an essential fix to the repeating alarm notifications we introduced in v1.17.0. If you enabled repeating notifications, Netdata would not then send CLEAR notifications for the selected alarms.
The release also includes a significant improvement to Netdata's auto-detection capabilities, especially after a system restart. Netdata now remembers which python.d plugin jobs were successfully collecting data the last time it was running, and retries to run those jobs for 5 minutes before giving up. As a result, you no longer have to worry if your system starts Netdata before the monitored services have had a chance to start properly. We will complete the same improvement for go.d plugins in v1.18.0.
We also made some improvements to our binary packages and added a neat sample custom dashboard that can show charts from multiple Netdata agents.
Acknowledgements
Our thanks go to:
-
tnyeanderson for
Dash.html, the custom dashboard that can show charts from multiple hosts. - qingkunl for improving the charts auto-scaling feature with nanosec and num units.
- Fohdeesha for documentation improvements
- Saruspete for improving debugging capabilities with tags for threads and his significant involvement in many other issues
Improvements
Binary packages
- netdata/packaging: Trigger stable package generation upon release process #6766 (paulkatsoulakis)
- netdata/packaging: Fix ubuntu/xenial runtime dependencies #6825 (paulkatsoulakis)
- netdata/packaging: Remove fedora/28, which is no longer available #6808 (paulkatsoulakis)
- netdata/packaging: Override control file for debian/buster #6777 (paulkatsoulakis)
GUI
- Expand dashboard auto-scaling and convertible units. Added two more units that allow auto-scaling and conversion: nanoseconds and num. #5920 (qingkunl)
Collector improvements
Documentation
- Fix pfsense instructions and links #6768 (Fohdeesha)
- Add high level explanation of dashboard contents #6648 (joelhans)
Other
- Update cache hashes for js and css #6756 (jacekkolasa)
- Provide a tag to identify the thread in the error messages. #6745 (Saruspete)
- Add sample multi-server dashboard
dash.html#6603 (tnyeanderson) - Replace hard-coded HTTP response codes #6595 (thiagoftsm)
Bug fixes
- Fix clear notifications for repeating alarms #6638 (thiagoftsm)
- Stop
configure.acfrom linking against dbengine and https libraries when dbengine or https are disabled #6658 (mfundul)
Published by netdatabot about 5 years ago
Release v1.17.0 contains 38 bug fixes, 33 improvements, and 20 documentation updates.
At a glance
You can now change the data collection frequency at will, without losing previously collected values. A major improvement to the new database engine allows you not only to store metrics at variable granularity, but also to autoscale the time axis of the charts, depending on the data collection frequencies used during the presented time.
You can also now monitor VM performance from one or more vCenter servers with a new VSphere collector. In addition, the proc plugin now also collects ZRAM device performance metrics and the apps plugin monitors process uptime for the defined process groups.
Continuing our efforts to integrate with as many existing solutions as possible, you can now directly archive metrics from Netdata to MongoDB via a new backend.
Netdata badges now support international (UTF8) characters! We also made our URL parser smarter, not only for international character support, but also for other strange API queries.
We also added .DEB packages to our binary distribution repositories at Packagecloud, a new collector for Linux zram device metrics, and support for plain text email notifications.
This release includes several fixes and improvements to the TLS encryption feature we introduced in v1.16.0. First, encryption slave-to-master streaming connections wasn't working as intended. And second, our community helped us discover cases where HTTP requests were not correctly redirected to HTTPS with TLS enabled. This release mitigates those issues and improves TLS support overall.
Finally, we improved the way Netdata displays charts with no metrics. By default, Netdata displays charts for disks, memory, and networks only when the associated metrics are not zero. Users could enable these charts permanently using the corresponding configuration options, but they would need to change more than 200 options. With this new improvement, users can enable all charts with zero values using a single, global configuration parameter.
Acknowledgements
Our thanks go to:
- Steve8291 for all his help across the board!
- alpes214 for improvements in health monitoring
-
fun04wr0ng for fixing a bug in the
nfacctplugin - RaZeR-RBI for the ZRAM collector module
- underhood for the UTF-8 parsing fixes in badges, that gave us support for internationalized badges
- Ferroin](https://github.com/Ferroin) for improving the python.d collectors handling of disconnected sockets
- dex4er for improving our OS detection code
- knatsakis for his help in our CI/CD pipeline
-
sunflowerbofh for
.gitignorefixes -
Cat7373 for fixing some issues with the
spigotmccollector
Improvements
Database engine
- Variable granularity support for data collection #6430 (mfundul)
- Added tips on the UI to encourage users to try the new DB Engine, when they reach the end of their metrics history #6711 (jacekkolasa)
Binary packages
- Added nightly generation of RPM/DEB amd64 packages #6675 (paulkatsoulakis)
- Provided built-in support for the prometheus remote write API in our packages #6480 (paulkatsoulakis)
- Documented distribution support matrix and functionality availability #6552 (paulkatsoulakis)
Health
- Added support for plain text only email notifications #6485 (leo-lb)
- Started showing “hidden” alarm variables in the responses of the
chartanddataAPI calls (#6054) #6615 (alpes214) - Added a new API call for alarm status counters, as a first step towards badges that will show the total number of alarms #6554 (alpes214)
Security
- Added configurable default locations for trusted CA certificates #6549 (thiagoftsm)
- Added safer way to get container names #6441 (ViViDboarder)
- Added SSL connection support to the python mongodb collector #6546 (ilyam8)
New collectors
- VSphere collector go.d.plugin PR241 #6572 (ilyam8)
Collector improvements
- rethinkdb collector new driver support #6431 (ilyam8)
- The apps plugin now displays process uptime charts #6654 (vlvkobal)
- Added ZRAM device metrics to the
proc.plugin#6276 #6424 (RaZeR-RBI)
Archiving
Documentation
- Add a statement about permissions for the diskspace plugin #6474 (vlvkobal)
- Improved the running behind Nginx guide #6466 (prhomhyse)
- Add more supported backends to the documentation #6443 (vlvkobal)
- Removed Ventureer from the list of demo sites #6442 (paulkatsoulakis)
- Updated docs health monitoring and health management api documentation #6435 (jghaanstra)
- Fixed issues in HTML docs generation, causing the hyperlink checks to function improperly #6433 (cakrit)
- New 'homepage' for documentation site #6428 (joelhans)
- Styling improvements to documentation #6425 (joelhans)
- Add documentation for binary packages, plus draft table for distributions support #6422 (paulkatsoulakis)
- Update netdata installation dependencies #6421 (paulkatsoulakis)
- Added better explanation of nightly and stable releases #6388 (joelhans)
- Add netdata haproxy documentation page #6454 (johnramsden)
- Added Netdata Cloud documentation #6476 (joelhans)
- Removed text about nightly version #6534 (joelhans)
- Provided documentation style guide & build instructions #6563 (joelhans)
- Install Netdata with Docker #6596 (prhomhyse)
- Fixed typos in: 'README.md' file. #6604 (coffeina)
- Change "netdata" to "Netdata" in all docs #6621 (joelhans)
- Fixed Markdown Lint warnings #6664 (prhomhyse)
- Improved Apache reverse proxy documentation on Content Security Policy #6667 (sunflowerbofh)
Other
- Updated our CLA, clarifying our intention to keep netdata FOSS #6504 (cakrit)
- Updated terms of use for U.S. legal reasons #6631 (cakrit)
- Updated logos in the infographic and remaining favicons #6417 (cakrit)
- SSL vs. TLS consistency and clarification in documentation #6414 (joelhans)
- Update Running-behind-apache.md #6406 (Steve8291)
- Fix Web API Health documentation #6404 (thiagoftsm)
- Added apps grouping debug messages #6375 (vlvkobal)
- GCC warning and linting improvements #6392 (ac000)
- Minor code readability changes #6539 (underhood)
- Added global configuration option to show charts with zero metrics #6419 (vlvkobal)
- Improved the way we parse HTTP requests, so we can avoid issues from edge cases #6247 #6714 (thiagoftsm)
- Build DEB and RPM packages in parallel #6579 (knatsakis)
- Updated package version requirements for LZ4 and libuv #6607 (mfundul)
- Improved system OS detection for RHEL6 and Mac OS X #6612 (dex4er)
- .travis.yml: Remove 'sudo: true' as it is now deprecated #6624 (knatsakis)
- Modified the documentation build process to accept <> around links in markdown #6646 (cakrit)
- Fixed spigotmc module typos in comments. #6680 (Cat7373)
Bug fixes
- Fixed the snappy library detection in some versions of OpenSuSE and CentOS #6479 (vlvkobal)
- Fixed sensor chips filtering in python sensors collector #6463 (ilyam8)
- Fixed user and group names in apps.plugin when running in a container, by mounting and reading
/etc/passwd#6472 (vlvkobal) - Fixed possible buffer overflow in the JSON parser used for health notification silencers #6460 (thiagoftsm)
- Fixed handling of corrupted DB files in dbengine, that could cause netdata to not start properly (CRC and I/O error handling) #6452 (mfundul)
- Stopped docs icon from linking to streaming page instead of docs root #6445 (joelhans)
- Fixed an issue with Netdata snapshots that could sometimes cause a problem during import. #6400 (jacekkolasa)
- Fixed bug that would cause netdata to attempt to kill already terminated threads again, on shutdown. #6387 (emmrk)
- Fixed out of memory (12) errors by reimplementing the myopen() function family #6339 (mfundul)
- Fixed wrong redirection of users signing in after clicking Nodes #6544 (jacekkolasa)
- Fixed python.d smartd collector increasing CPU usage #6540 (ilyam8)
- Fixed missing navigation arrow in Documentation #6533 (joelhans)
- Fixed mongodb python collector stock configuration mistake, by changing
passwordtopass#6518 (ilyam8) - Fixed broken left navbar links in translated docs #6505 (cakrit)
- Fixed handling of UTF8 characters in badges and added International Support to the URL parser #6426 (underhood)
- Fixed nodes menu sizing (responsive) #6455 (builat)
- Fixed issues with http redirection to https and streaming encryption #6468 (thiagoftsm)
- Fixed broken links to
arcstat.pyandarc_summary.pyin dashboard_info.js #6461 (TheLovinator1) - Fixed bug with the nfacct plugin that resulted in missing dimensions from the charts #6098 (fun04wr0ng)
- Stopped anonymous stats from trying to write a log under
/tmp#6491 (cakrit) - Fixed a problem with
edit-config, the configuration editor, not being able to run in MacOS. We no longer deliver edit-config as part of the distribution tarball, so that it can get generated with proper configuration during installation .#6507 (paulkatsoulakis) - Fixed issue with the netdata-updater that caused it not to run properly in static64 installations. #6520 (paulkatsoulakis)
- Fixed some yamllint errors in our Travis configuration #6526 (knatsakis)
- Properly delete obsolete dimensions for inactive disks in smartd_log #6547 (ilyam8)
- Fixed
.environmentfile getting overwritten, by moving tarball checksum information into lib dir of netdata #6555 (paulkatsoulakis) - Fixed handling of disconnected sockets in unbound python.d collector. #6561 (Ferroin)
- Fixed crash in malloc #6583 (thiagoftsm)
- Fixed installer error
undefined reference to LZ4_compress_default#6589 (mfundul) - Fixed issue with mysql collector that resulted in showing only a single slave_status chart, regardless of the number of replication channels #6597 (ilyam8)
- Fixed installer issue that would automatically enable the netdata service, even, if it was previously disabled #6606 (paulkatsoulakis)
- Fixed a segmentation fault in backends #6627 (vlvkobal)
- Fixed spigotmc plugin bugs #6635 (Cat7373)
- Fixed installer error when running
kickstart.shas a non-privileged user #6642 (paulkatsoulakis) - Fixed issue causing OpenSSL libraries to not be found on gentoo #6670 (paulkatsoulakis)
- Fixed dbengine 100% CPU usage due to corrupted transaction payload handling #6731 (mfundul)
- Fixed wrong default paths in certain installations #6678 (paulkatsoulakis)
- Fixed exact path to netdata.conf in .gitignore #6709 (sunflowerbofh)
- Fixed static64 installer bug that resulted in always overwriting configuration #6710 (paulkatsoulakis)
Thanks to the community for their help!
Published by netdatabot over 5 years ago
Release v1.16.0 contains 40 bug fixes, 31 improvements and 20 documentation updates
At a glance
Binary distributions. To improve the security, speed and reliability of new netdata installations, we are delivering our own, industry standard installation method, with binary package distributions. The RPM binaries for the most common OSs are already available on packagecloud and we’ll have the DEB ones available very soon. All distributions are considered in Beta and, as always, we depend on our amazing community for feedback on improvements.
- Our stable distributions are at netdata/netdata @ packagecloud.io
- The nightly builds are at netdata/netdata-edge @ packagecloud.io
Netdata now supports SSL encryption! You can secure the communication to the web server, the streaming connections from slaves to the master and the connection to an openTSDB backend.
This version also brings two long-awaited features to netdata’s health monitoring:
- The health management API introduced in v1.12 allowed you to easily disable alarms and/or notifications while netdata was running. However, those changes were not persisted across netdata restarts. Since part of routine maintenance activities may involve completely restarting a monitoring node, netdata now saves these configurations to disk, every time you issue a command to change the silencer settings. The new LIST command of the API allows you to view at any time which alarms are currently disabled or silenced.
- A way for netdata to repeatedly send alarm notifications for some, or all active alarms, at a frequency of your choosing. As a result, you will no longer have to worry about missing a notification, forgetting about a raised alarm. The default is still to only send a single notification, so that existing users are not surprised by a different behavior.
As always, we’ve introduced new collectors, 5 of them this time.
- Of special interest to people with Windows servers in their infrastructure is the WMI collector, though we are fully aware that we need to continue our efforts to do a proper port to Windows.
- The new
perfplugin collects system-wide CPU performance statistics from Performance Monitoring Units (PMU) using theperf_event_open()system call. You can read a wonderful article on why this is useful here. - The other three are collectors to monitor Dnsmasq DHCP leases, Riak KV servers and Pihole instances.
Finally, the DB Engine introduced in v1.15.0 now uses much less memory and is more robust than before.
Acknowledgements
As you’ll see in the detailed list below, once again we’ve had great help from our contributors.
- Steve8291 was helping everywhere
- apardyl added useful new alarms and helped with documentation
- jchristgit wrote the Riak KV collector
- Saruspete made improvements to the freeipmi plugin
- kam1kaze has added new charts to the python mysql collector
- akwan and mbarper improved the application monitoring, with new process groupings
- nodiscc helped with bug and documentation fixes
- dankohn) helped with the documentation
- andvgal added an amazing configuration to help us run proper lint checks on our markdown files
- octomike, Danamir, mbarper, Wing924, n0coast and toofar delivered bug fixes
- josecv helped improve the Kubernetes helm chart.
We can't stress enough the immense help we get just from users creating an issue in GitHub, helping us identify the root cause and validate the change in their infrastructure. Unfortunately, we are not able to list all of them here, but their contribution is invaluable.
Improvements
Binary packages
- Introduced automatic binary packages generation and delivery for RPM types (Phase 1) #6223 #6369 (paulkatsoulakis)
Health
- Easily disable alarms, by persisting the silencers configuration #6274 #6360 (thiagoftsm)
- Repeating alarm notifications #6309 (thiagoftsm) and (kamcpp)
- Simplified the health cmdapi tester - no setup/cleanup needed #6210 (cakrit)
- Αdd last_collected alarm to the x509check collector #6139 (ilyam8)
- New alarm for abnormally high number of active processes. #6116 (apardyl)
Security
- SSL support in the web server and streaming/replication #5956 (thiagoftsm)
- Support encrypted connections to OpenTSDB backends #6220 (thiagoftsm)
- Show the security policy directly from GitHub #6163 #6166 (cakrit)
New collectors
- Go.d collector modules for WMI, [Dnsmasq DHCP leases)(https://github.com/netdata/go.d.plugin/tree/master/modules/dnsmasq_dhcp) and Pihole (ilyam8)
- Riak KV instances collector #6286 (jchristgit)
- CPU performance statistics using Performance Monitoring Units (PMU) via the
perf_event_open()system call. (perf plugin) #6225 (vlvkobal)
Collector improvements
- Handle different sensor IDs for the same element in the freeipmi plugin #6296 (Saruspete)
- Increase the cpu_limit chart precision in cgroup plugin #6172 (vlvkobal)
- Added
userstatsanddeadlockscharts to the python mysql collector #6118 #6115 (kam1kaze) - Add perforce server process monitoring to the apps plugin #6064 (akwan)
Backends
DB engine improvements
- Reduced memory requirements by 40-50% #6134 (mfundul)
- Reduced the number of pages needed to be stored and indexed when using
memory mode = dbengine, by adding empty page detection #6173 (mfundul)
Rebranding
- Updated the netdata logo and changed links to point to the new website #6359 #6398 (cakrit), #6396 (ivorjvr), #6389 (joelhans)
Documentation
- Improve documentation about file descriptors and systemd configuration. #6372 (mfundul)
- Update the documentation on charts with zero metrics #6314 (vlvkobal)
- Document that that in versions before 1.16, the plugins.d directory may be installed in a different location in certain OSs #6301 (cakrit)
- Remove single and multi-threaded web server configuration instructions #6291 (nodiscc)
- Add more info on the
stream.confoptionhealth enabled by default = auto#6281 (cakrit) - Add comments about AWS SDK for C++ installation #6277 (vlvkobal)
- Fix on the installation readme regarding the supported systems (first came RedHat, then the others) #6271 (paulkatsoulakis)
- Update the new dbengine documentation #6264 (mfundul)
- Remove CNCF logo and TOC presentation reference #6234 (dankohn)
- Added code style guidance to CONTRIBUTING #6212 (cakrit)
- Visibility fix for anonymous statistics #6208 (cakrit)
- smartd documentation improvements #6207 (cakrit), #6203 (Steve8291)
- Made custom notification's instructions clearer #6181 (cakrit)
- Fix typo in the web server README #6146 (cakrit)
- Registry documentation fixes #6144 (cakrit)
- Changed 'netdata' to 'Netdata' in /docs/ and /README.md #6137 (apardyl)
- Update installer readme with OpenSUSE dependencies #6111 (mfundul)
- Fixed minor typos in the daemon configuration documentation #6090 (Steve8291)
- Mention anonymous statistics in additional places in the docs #6084 (cakrit)
- Local remark-lint checks and autofix support #5898 (andvgal)
Other
- Pass the the
cloud base urlparameter to the notifications mechanism, so that modifications to the configuration are respected when creating the link to the alarm #6383 (ladakis) - Added a
.gitattributesfile to improvegit difffor C files #6381 (ac000) - Improved logging, to be able to trace the
CRITICAL: main[main] SIGPIPE received.error #6373 (vlvkobal) - Modify the limits of the stale bot, to close stale questions/discussions in GitHub faster #6297 (ilyam8)
- Internal CI/CD improvements #6282 #6268 (paulkatsoulakis)
- netdata/packaging: Add more distribution validations #6235 (paulkatsoulakis)
- Move call to send_statistics later, to get more telemetry events from docker containers #6113 (vlvkobal), #6096 (cakrit)
- Use github templating mechanisms to classify issues when they are created #5776 (paulfantom)
Bug fixes
- Fixed
ram_availablealarm #6261 (octomike) - Stop monitoring
/devand/runin the disk space and inode usage charts #6399 (vlvkobal) - Fixed the monitoring of the “time” group of processes #6397 (mbarper)
- Fixed compilation error
PERF_COUNT_HW_REF_CPU_CYCLES' undeclared herein old Linux kernels (perf plugin) #6382 (vlvkobal) - Fixed autodetection for openldap on Debian (apps.plugin) #6364 (nodiscc)
- Fixed compilation error on CentOS 6 (nfacct plugin) #6351 (vlvkobal)
- Fixed invalid XML page error (tomcat plugin) #6345 (Danamir)
- Remove obsolete monit metrics #6340 (ilyam8)
- Fixed
Failed to parseerror in adaptec_raid #6338 (ilyam8) - Fixed
cluster_health_nodesandcluster_stats_nodescharts in the elasticsearch collector #6311 (Wing924) - A modified slave chart's "name" was not properly transferred to the master (streaming) #6304 (vlvkobal)
- Netdata could run out of file descriptors when using the new DB engine #6303 (mfundul)
- Fixed UI behavior when pressing the
Endkey #6294 (thiagoftsm) - Fixed UI link to check the configuration file, to open in a new tab #6294 (thiagoftsm)
- Fixed files not found during installation, due to different than expected location of the
libexecdirdirectory #6272 (paulkatsoulakis) - Prevented
Error: 'module' object has no attribute 'Retry'messages from python collectors, by enforcing minimum version check for theUrlServicelibrary #6263 (ilyam8) - Fixed typo that causes nfacct.plugin log messages to incorrectly show
freeipmi#6260 (vlvkobal) - Fixed netdata/netdata docker image failure, when users pass a PGID that already exists on the system #6259 (paulkatsoulakis)
- The daemon could get stuck during collection or during shutdown, when using the new dbengine. Reduced new dbengine IO utilization by forcing page alignment per dimension of chart. #6240 (mfundul)
- Properly handle timeouts/no response in dns_query_time python collector #6237 (n0coast)
- When a collector restarted after having stopped for a long time, the new dbengine would consume a lot of CPU resources. #6216 (mfundul)
- Fixed error
Assertionold_state & PG_CACHE_DESCR_ALLOCATED' failed` of the new dbengine. Eliminated a page cache descriptor race condition #6202 (mfundul) - tv.html failed to load the three left charts when accessed via https. Turn tv.html links to https #6198 (cakrit)
- Change print level from error to info for messages about clearing old files from the database#6195 (mfundul)
- Fixed warning regarding the x509check_last_collected_secs alarms. Changed the template update frequency to 60s, to match the chart’s update frequency #6194 (ilyam8)
- Email notification header lines were not terminated with
\r\nas per the RFC #6187 (toofar) - Some log entries would not be caught by the python web_log plugin. Fixed the regular expressions #6138 #6180 (ilyam8)
- Corrected the date used in pushbullet notifications #6179 (cakrit)
- Fixed FATAL error when using the new dbengine with no direct I/O support, by falling back to buffered I/O #6174 (mfundul)
- Fixed compatibility issues with varnish v4 (varnish collector) #6168 (ilyam8)
- The total number of disks in mdstat.XX_disks chart was displayed incorrectly. Fixed the "inuse" and "down" disks stacking. #6164 (vlvkobal)
- The config option --disable-telemetry was being checked after restarting netdata, which means that we would still send anonymous statistics the first time netdata was started. #6127 (cakrit)
- Fixed apcupsd collector errors, by passing correct info to the run function. #6126 (Steve8291)
- apcupsd and libreswan were not enabled by default #6120 (Steve8291)
- Fixed incorrect module name: energi to energid #6112 (Steve8291)
- The nodes view did not work properly when a reverse proxy was configured to access netdata via paths containing subpaths (e.g. myserver/netdata) #6093 (gmosx)
- Fix error message
PLUGINSD : cannot open plugins directory#6080 #6089 (Steve8291) - Corrected invalid links to web_log.conf that appear on the agent UI #6087 (cakrit)
- Fixed ScaleIO collector endpoint paths go.d PR 226 ilyam8
- Fixed web client timeout handling in the go.d plugin httpcheck collector go.d PR 225 ilyam8
Published by netdatabot over 5 years ago
Release v1.15.0 contains 11 bug fixes and 30 improvements.
At a glance
We are very happy and proud to be able to include two major improvements in this release: The aggregated node view and the new database engine.
Aggregated node view
The No. 1 request from our community has been a better way to view and manage their Netdata installations, via an aggregated view. The node menu with the simple list of hosts on the agent UI just didn't do it for people with hundreds, or thousands of instances. This release introduces the node view, which uses the power of Netdata Cloud to deliver powerful views of a Netdata-based monitoring infrastructure.

You can read more about Netdata Cloud and the future of netdata here.
New database engine
Historically, Netdata has required a lot of memory for long-term metrics storage. To mitigate this we've been building a new DB engine for several months and will continue improving until it can become the default memory mode for new Netdata installations. The version included in release v1.15.0 already permits longer-term storage of compressed data and we'll continue reducing the required memory in following releases.
Other major additions
We have added support for the AWS Kinesis backend and new collectors for OpenVPN, the Tengine web server, ScaleIO (VxFlex OS), ioping-like latency metrics and Energi Core node instances.
We now have a new, "text-only" chart type, cpu limits for v2 cgroups, docker swarm metrics and improved documentation.
We continued improving the Kubernetes helmchart with liveness probes for slaves, persistence options, a fix for a Cannot allocate memory issue and easy configuration for the kubelet, kube-proxy and coredns collectors.
Finally, we built a process to quickly replace any problematic nightly builds and added more automated CI tests to prevent such builds from being published in the first place.
Acknowledgements
Our heartfelt gratitude for this release goes to the following people:
- @kam1kaze for help with Kubernetes, a fix for the Docker image and documentation improvements.
- @andvgal for the Energi Core daemon collector and the improvement of the python.d plugin.
- @skrzyp1 for improving cgroup monitoring.
- @Daniel15 for the much sought-after "text-only" new chart type.
- @Fohdeesha, @SahAssar, and @smonff for improving the documentation.
- @etienne-napoleone, @karuppiah7890 and @varyumin for their contributions to the Kubernetes helm chart.
Improvements
- Support for aggregate node view #5902 (gmosx)
- Database engine #5282 (mfundul)
- New collector modules:
- Go.d collectors for OpenVPN, the Tengine web server and ScaleIO (VxFlex OS) instances (ilyam8)
- Monitor disk access latency like ioping does #5725 (vlvkobal)
- Energi Core daemon monitoring, suits other Bitcoin forks #5894 (andvgal)
- Collector improvements:
- Support the AWS Kinesis backend for long-term storage #5914 (vlvkobal)
- Add a new "text-only" chart renderer #5971 (Daniel15)
- Packaging and CI improvements:
- We can now fix more quickly any problematic published builds via a new manual deployment procedure #5899 (paulkatsoulakis)
- We added more tests to our nightly builds, to catch more errors before publishing images #5918 (paulkatsoulakis)
- API Improvements:
- Kubernetes helmchart improvements:
- Added the init container, where sysctl params could be managed, to bypass the
Cannot allocate memoryissue #18 (kam1kaze) - Better startup/shutdown of slaves and reduced memory usage with liveness/readiness probes and default memory mode none #19 (cakrit)
- Added the option of overriding the default settings for kubelet, kubeproxy and coredns collectors via values.yaml #24 (cakrit)
- Make the use of persistent volumes optional, add
apiVersionto fix linting errors and correct the location of theenvfield #22, #23 (karuppiah7890) - Fix incorrect parameter names in the README #24 (etienne-napoleone)
- Added the init container, where sysctl params could be managed, to bypass the
- Documentation improvements:
Bug fixes
- Prowl notifications were not being sent, unless another notification method was also active #6022 (cakrit)
- Fix exception handling in the python.d plugin #5997 (ilyam8)
- The
nodeapplications group did not include all node processes. #5962 (jonfairbanks) - Installation would show incorrect message "FAILED Cannot install netdata init service." in some cases #5947 (paulkatsoulakis)
- The nvidia_smi collector displayed incorrect power usage #5940 (ilyam8)
- The python.d plugin would sometimes hang, because it lacked a connect timeout #5911 (ilyam8)
- The mongodb collector raised errors due to various KeyErrors #5931 (ilyam8)
- The smartd_log collector would show incorrect temperature values #5923 (ilyam8)
- charts.d plugins would fail on docker, when using the
timeoutcommand #5938 (paulkatsoulakis) - Docker image had plugins not executable by user netdata #5917 (paulkatsoulakis)
- Docker image was missing the
lsnscommand, used to match network interfaces to containers #1 (kam1kaze)
Published by netdatabot over 5 years ago
Release 1.14 contains 14 bug fixes and 24 improvements.
At a glance
The release introduces major additions to Kubernetes monitoring, with tens of new charts for Kubelet, kube-proxy and coredns metrics, as well as significant improvements to the netdata helm chart.
Two new collectors were added, to monitor Docker hub and Docker engine metrics.
Finally, v1.14 adds support for version 2 cgroups, OpenLDAP over TLS, NVIDIA SMI free and per process memory and configurable syslog facilities.
Acknowledgements
Our contributors kicked the ball out of the park this time. Our thanks go to the following people:
@ekartsonakis for the excellent addition of TLS support to the OpenLDAP collector
@Wing924 whose cat apparently leaves him enough time to help us with springboot2 and a lot more!
@huww98 for his contribution to the NVIDIA SMI plugin.
@varyumin for his help on the Kubernetes helm chart.
@skrzyp1 for the very significant addition of cgroup v2 support
@hsegnitz for his contribution to the web server log plugin.
@archisgore for the quick fixes to the Polyverse-enabled docker image.
@tctovsli for his Rocket Chat notifications improvements.
@JoeWrightss and @vinyasmusic for not letting us get away with spelling mistakes.
@andvgal for the addition to the MongoDB collector.
@piiiggg for the apache proxy documentation fix
@Ferroin for general awesomeness.
Bug Fixes
- Fixed cases where the netdata version produced by the binary or the configure tools of the source code was wrong. Instead of getting something like
netdata-v1.14.0-rc0-39a9sf9gwe would get anetdata-39a9sf9g. #5860 (paulkatsoulakis) - Fixed unexpected crashes of the python plugin on macOS, caused by new security changes made in High Sierra. #5838 (ilyam8)
- Fixed problem autodetecting failed jobs in python.d plugin. It now properly restarts jobs that are being rechecked, as soon as they are able to run. #5837 (ilyam8)
- CouchdDB monitoring would stop sometimes with an exception. Fixed the unhandled exception causing the issue. #5833 (ilyam8)
- The netdata api deliberately returned http error 400 when netdata ran in memory mode none. Modified the behavior to return responses, regardless of the memory mode #5819 (cakrit)
- The python.d plugin sometimes does not receive
SIGTERMwhen netdata exits, resulting in zombie processes. Added a heartbeat so that the process can exit onSIGPIPE. #5797 (ilyam8) - The new SMS Server Tools notifications did not handle errors well, resulting in cryptic error messages. Improved error handling. #5770 (cakrit)
- The installers would crash on some FreeBSD systems, because
sha256sumused by the installers is not available on all FreeBSD installations. Modified the installers to properly support FreeBSD. #5760 (paulkatsoulakis) - Running netdata behind a proxy in FreeBSD did not work, when using UNIX sockets. Added special handling of UNIX sockets for FreeBSD. #5756 (vlvkobal)
- Fixed sporadic build failures of our Docker image, due to dependencies on the Polyverse package ( APK broken state). #5751 (archisgore)
- Fix segmentation fault in streaming, when two dimensions had similar names. #5882 (vlvkobal)
- Kubernetes Helm Chart: Fixed incorrect use of namespaces in ServiceAccount and ClusterRoleBinding RBAC fixes (varyumin).
- Elastic search: The option to enable HTTPS was not included in the config file, giving the erroneous impression that HTTPS was not supported. The option was added. [#5834] (https://github.com/netdata/netdata/pull/5834) (ilyam8)
- RocketChat notifications were not being sent properly. Added default recipients for roles in the health alarm notification configuration. #5545 (tctovsli)
Improvements
- go.d.plugin v0.4.0 : Docker Hub and k8s coredns collectors, springboot2 URI filters support.
- go.d.plugin v0.3.1 : Add default job to run k8s_kubelet.conf, k8s_kubeproxy, activemq modules
- go.d.plugin v0.3.0 : Docker engine, kubelet and kub-proxy collectors. x509check module reading certs from file support
- Added unified cgroup support that includes v2 cgroups #5407 (skrzyp1)
- Disk stats: Added preferred disk id pattern, so that users can see the id they prefer, when multiple ids appear for the same device #5779 (vlvkobal)
- NVIDIA SMI: Added memory free and per process memory usage charts to the collector #5796 (huww98)
- OpenLDAP: Added TLS support, to allow monitoring of LDAPS. #5859 (ekartsonakis)
- PHP-FPM: Add health check to raise alarms when the phpfm server is unreachable #5836 (ilyam8)
- PostgreSQL: Our configuration options to connect to a DB did not support all possible option. Added option to connect to a PostreSQL instance by defining a connection string (URI). #5758 (ilyam8)
- python.d.plugin: There was no way to delete obsolete dimensions in charts created by the python.d plugin. The plugin can now delete dimension at runtime. #5795 (ilyam8)
- netdata supports sending its logs to Syslog, but the facility was hard-coded. We now support configurable Syslog facilities in
netdata.conf. #5792 (thiagoftsm) - We encountered sporadic failures of our kickstart installation scripts after nightly releases. We add integrity tests to our pipeline to ensure we prevent faulty scripts from getting deployed. #5778 (paulkatsoulakis)
-
Kubernetes Helm Chart improvements: (cakrit) and (varyumin).
- Added serviceName in statefulset spec to align with the k8s documentation
- Added preStart command to persist slave machine GUIDs, so that pod deletion/addition during upgrades doesn't lose the slave history.
- Disabled non-essential master netdata collector plugins to avoid duplicate data
- Added preStop command to wait for netdata to exit gracefully before removing the container
- Extended configuration file support to provide more control from the helm command line
- Added option to disable Role-based access control
- Added liveness and readiness probes.
Published by netdatabot over 5 years ago
Release 1.13 contains 14 bug fixes and 8 improvements.
At a glance
netdata has taken the first step into the world of Kubernetes, with a beta version of a Helm chart for deployment to a k8s cluster and proper naming of the cgroup containers. We have big plans for Kubernetes, so stay tuned!
A major refactoring of the python.d plugin has resulted in a dramatic decrease of the required memory, making netdata even more resource efficient.
We also added charts for IPC shared memory segments and total memory used.
Acknowledgements:
- varyumin, who graciously shared the original Kubernetes Helm chart and is still helping improve it
- p-thurner for his great work on the SSL certificate expiration module.
- Ferroin for his priceless insights and assistance
- Jaxmetalmax for graciously helping us identify and fix postgress connection issues
Improvements
- Kubernetes: Helm chart (https://github.com/netdata/helmchart) and proper cgroup naming #5576 (cakrit)
- python.d.plugin: Reduce memory usage with separate process for initial module checking #5552 (ilyam8) and loaders cleanup #5602 (ilyam8)
- IPC shared memory charts #5522 (vlvkobal)
- mysql module add ssl connection support #5610 (ilyam8)
- FreeIPMI: Have the debug option apply the internal freeipmi debug flags #5548 (cakrit)
- Prometheus backend: Support legacy metric names for source=avg #5531 (cakrit)
- Registry: Allow deleting the host we are looking at #5537 (cakrit)
- SpigotMC: Use regexes for parsing. #5507 (Ferroin)
Bug Fixes
- Postgres: fix connection issues #5618 (Jaxmetalmax), #5617 (ilyam8)
- Proxmox container: Fix cgroup naming #5612 (vlvkobal) and use total_* memory counters for cgroups #5592 (vlvkobal)
- proc.plugin and plugins.d: Fix memory leaks #5604 (vlvkobal)
- SpigotMC: Fix UnicodeDecodeError #5598 (ilyam8) and py2 compatibility fix #5593 (ilyam8)
- Fix non-obsolete dimension deletion #5563 (vlvkobal)
- UI: Fix incorrect icon for the streaming master #5560 #5561 (gmosx)
- Docker container names: Retry renaming when a name is not found #5557 (vlvkobal)
- apps.plugin: Don't send zeroes for empty process groups #5540 (vlvkobal)
- go.d.plugin: Correct sha256sum check #5539 (cakrit)
- Unbound module: Documentation corrected with troubleshooting section. #5528 (Ferroin)
- Streaming: Prevent UI issues upon GUID duplication between master and slave netdata instances #5511 (paulkatsoulakis)
- Linux power supply module: Fix missing zero dimensions #5395 (vlvkobal)
- Minor fixes around plugin_directories initialization #5536 (paulkatsoulakis)
Published by netdatabot over 5 years ago
Patch release 1.12.2 contains 7 bug fixes and 4 improvements.
At a glance
The main motivation behind a new patch release is the introduction of a stable release channel.
A "stable" installation and update channel was always on our roadmap, but it became a necessity when we realized that our users in China could not use the nightly releases published on Google Cloud. The "stable" channel is based on our official GitHub releases and uses assets hosted on GitHub.
We are also introducing a new Oracle DB collector module, implemented in Python.
Bug Fixes
- Installer at https://my-netdata.io/kickstart.sh isnt updated to master branch #5492
- Zombie processes exist after restart netdata - add heartbeat to python.d plugin #5491
- Verbose curl output causes unwanted emails from netdata-updater cronjob #5484
- RocketChat notifications not working #5470
- go.d.plugin installation fails due to insufficient timeout #5467
- SIGSEGV crash during shutdown of tc plugin #5366
- CMake warning for nfacct plugin #5379
Improvements
Published by netdatabot over 5 years ago
Patch release 1.12.1 contains 22 bug fixes and 8 improvements.
Bug Fixes
- Fix SIGSEGV at startup: Don't free vars of charts that do not exist #5455
- Add timeouts to the installer for the go.d plugin and update the installer documentation for servers with no internet access.
- Prevent invalid Linux power supply alarms during startup #5447
- Correct duplicate flag enum in health.h #5441
- Remove extra 'v' for netdata version from Server response header #5440 and spec URL #5427
- Fix curl download in installer #5439
- apcupsd - Treat ONBATT status the same as ONLINE #5435
- Fix #5430 - LogService._get_raw_data under python3 fails on undecodable data #5431
- Correct version check in UI #5429
- Fix ERROR 405: Cannot download charts index from server - cpuidle handle newlines in names #5425
- Improve configure.ac mnl and netfilter_acc checks for static builds #5424
- Fix clock_gettime() failures with the CLOCK_BOOTTIME argument #5415
- Use netnsid for detecting cgroup networks; #5413
- Python module sensors fix #5406 (ilyam8)
- Fix kickstart-static64.sh script #5397
- Fix ceph.chart.py for Python3 #5396 (GaetanF)
- Added missing BuildRequires for autoconf, automake #5363
- Fix wget log spam in headless mode (fixes #5356) #5359
- Fix warning condition for mem.available #5353
- cups.plugin: Support older versions #5350
- Fix AC_CHECK_LIB to work correctly with cups library #5349
- Fix issues reported by Codacy
Improvements
- Add driver-type option to the freeipmi plugin #5384
- Add support of tera-byte size for Linux bcache. #5373
- Split nfacct plugin into separate process #5361
- Localization support in HTML docs, simplification of checklinks.sh #5342
- Cleanup updater script and no
/optusage #5218 - Add cgroup cpu and memory limits and alarms #5172
- Add message queue statistics #5115
- Documentation improvements
Published by netdatabot over 5 years ago
At a glance
Release 1.12 is made out of 211 pull requests and 22 bug fixes.
The key improvements are:
- Introducing
netdata.cloud, the free netdata service for all netdata users - High performance plugins with go.d.plugin (data collection orchestrator written in Go)
- 7 new data collectors and 11 rewrites of existing data collectors for improved performance
- A new management API for all netdata servers
- Bind different functions of the netdata APIs to different ports
- Improved installation and updates
netdata.cloud
netdata.cloud is a free service for all netdata users. Currently it replaces the old netdata registry, while providing single sign on with GitHub and Google accounts.
Using netdata.cloud we plan to provide the following features:
- distributed authentication (password protection) for all netdata installations
- network view for all nodes
- cross node custom dashboard editor, storage and sharing
- centralized health monitoring and alarm notifications
and many more.
Read more about netdata.cloud here.
Bind API functions to different ports
netdata can now bind its API functions to different ports.
The following API functions can be isolated:
-
dashboardfor access the dashboard -
badgesfor generating badges -
streamingfor receiving streamed metrics from remote netdata servers -
managementfor receiving management commands -
registryfor accessing the netdata registry -
netdata.conffor downloading the current configuration
To bind API functions to different ports, append =function|function|... to the port definition, like this:
[web]
   bind to = *:19999=dashboard|netdata.conf *:20000=streaming
The above will bind netdata:
- on all IPs (
*) at port19999for dashboard access and access tonetdata.conf - on all IPs (
*) at port20000for receiving streamed data from remote netdata servers
For more information about binding API functions to different ports, check this.
Management API
Netdata now has a management API. We plan to provide a full set of configuration commands using this API.
In this release, the management API supports disabling or silencing alarms during maintenance periods.
For more information about the management API, check this.
Anonymous statistics
Anonymous usage information is collected by default and sent to Google Analytics. The statistics calculated from this information will be used for:
-
Quality assurance, to help us understand if netdata behaves as expected and help us identify repeating issues for certain distributions or environment.
-
Usage statistics, to help us focus on the parts of netdata that are used the most, or help us identify the extend our development decisions influence the community.
Information is sent to Netdata via two different channels:
- Google Tag Manager is used when an agent's dashboard is accessed.
- The script
anonymous-statistics.shis executed by the Netdata daemon, when Netdata starts, stops cleanly, or fails.
Both methods are controlled via the same opt-out mechanism.
For more information, check this.
Data collection
This release introduces a new Go plugin orchestrator. This plugin has its own github repo. It is open-source, using the same license and we welcome contributions. The orchestrator can also be used to build custom data collection plugins written in Go. We have used the orchestrator to write many new Go plugins in our go.d plugin github repo. For more information, check this.
New data collectors:
- Activemq (Go)
- Consul (Go)
- Lighttpd2 (Go)
- Solr (Go)
- Springboot2 (Go)
- mdstat - nonredundant arrays (C)
- CUPS printing system (C)
High performance versions of older data collectors:
- apache (Go)
- dns_query (Go)
- Freeradius (Go)
- Httpcheck (Go)
- Lighttpd (Go)
- Portcheck (Go)
- Nginx (Go)
- cpufreq (C)
- cpuidle (C)
- mdstat (C)
- power supply (C)
Other improved data collectors:
- Fix the python plugin clock (collectors falling behind).
- adaptec_raid: add to python.d.conf.
- apcupsd: Detect if UPS is online.
- apps: Fix process statistics collection for FreeBSD.
- apps: Properly lookup docker container name when running in ECS.
- fail2ban: Add 'Restore Ban' action.
- go_expavar: Don't check for duplicate expvars.
- hddtemp: Don't use disk model as dim name.
- megacli: add to python.d.conf.
- nvidia_smi: handle
N/Avalues. - postgres: Fix integer out of range error on Postgres 11, fix locks count.
- proc: Don't show zero charts for ZFS filesystem.
- proc; Fix cached memory calculation.
- sensors: Don't ignore 0 RPM fans on start.
- smartd_log: check() unhandled exception: list index out of range.
- SNMP: Gracefully ignore the offset if the value is not a number.
Packaging and Installation
- Upload nightly builds to Google Cloud. Use the nightlies in new installations and updates.
- Improved uninstaller.
- Scramble packages in docker images with polymorphic Linux.
- Building RPMs: Fix permissions for log files, remove rolling version suffix.
Health Monitoring
- Add Prowl notifications for iOS users.
- Show count of active alarms per state in email notifications.
- Show evaluated expression and expression variable values in email notifications.
- Improve support for slack recipients (channels/users).
- Custom notifications: Fix bug with alarm role recipients.
Dashboards
- Server filtering in
my-netdatamenu when signed in tonetdata.cloud - All units are now IEC-compliant abbreviations (KiB, MiB etc.).
- GUI: Make entire row clickable in the registry menu showing the list of servers.
Backends
- Do not report stale metrics to prometheus.
Other
- Deprecated multi-threaded and single-threaded web servers, in preparation for Windows support.
- Documentation improvements.
- Treat
DT_UNKNOWNfiles as regular files. - API: Stricter rules for URL separators.
Published by netdatabot almost 6 years ago
This is a patch - bug fix release of netdata.
Our work to move all the documentation inside the repo is still in progress. Everything has been moved, but still we need to refactor a lot of the pages to be more meaningful.
The README file on netdata home has been rewritten. Check it here.
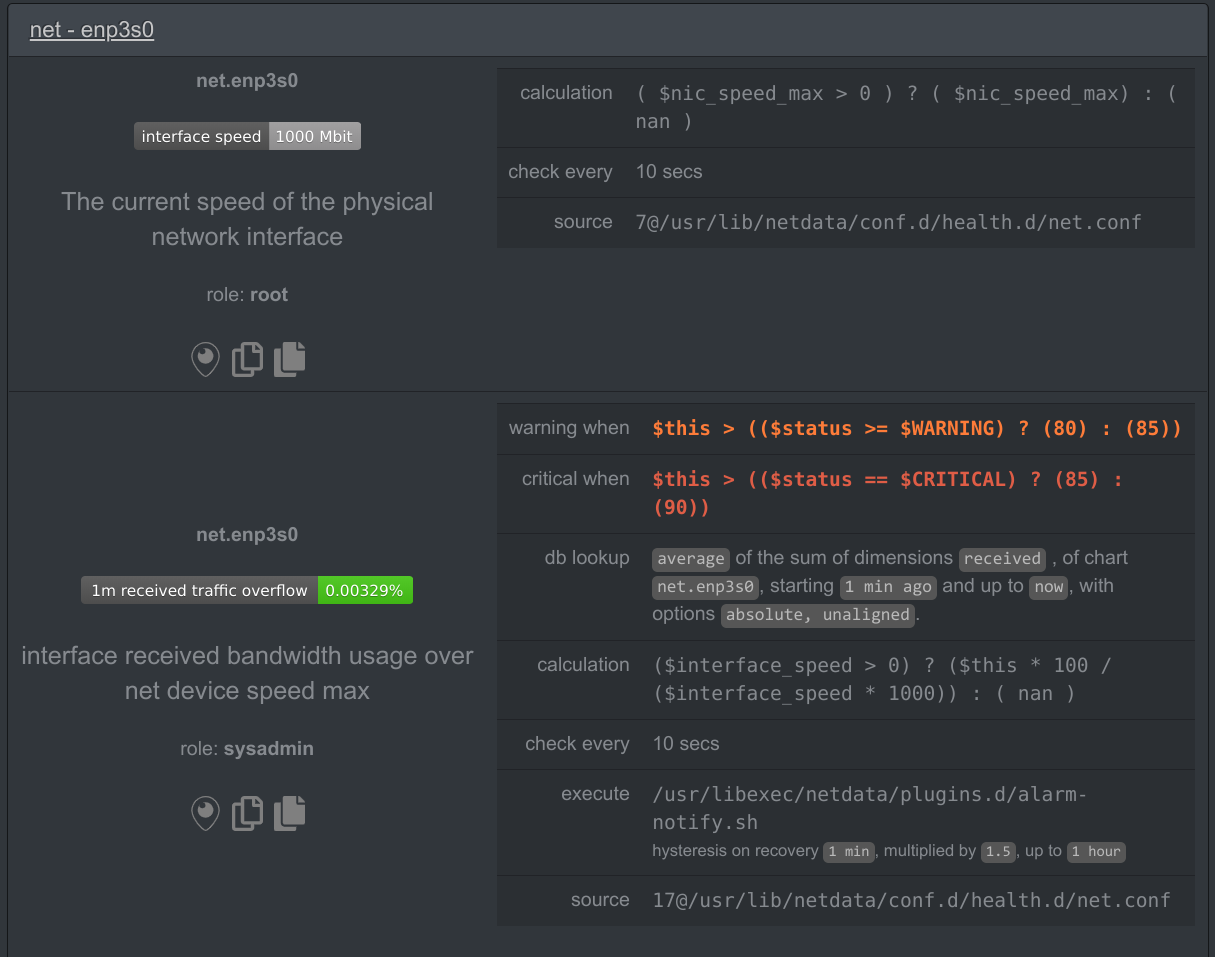
Improved internal database
Overflown incremental values (counters) do not show a zero point at the charts. Netdata detects the width (8bit, 16bit, 32bit, 64bit) of each counter and properly calculates the delta when the counter overflows.
The internal database format has been extended to support values above 64bit.
New data collection plugins
-
openldap, to collect performance statistics from OpenLDAP servers. -
tor, to collect traffic statistics from Tor. -
nvidia_smito monitor NVIDIA GPUs.
Improved data collection plugins
-
BUG FIX: network interface names with colon (
:) in them were incorrectly parsed and resulted in faulty data collection values. -
BUG FIX:
smartd_loghas been refactored, has better python v2 compatibility, and now supports SCSI smart attributes -
cpufreqhas been re-written in C - since this module if common, we decided to convert to an internal plugin to lower the pressure on the python ones. There are a few more that will be transitioned to C in the next release. -
BUG FIX:
sensorsgot some compatibility fixes and improved handling forlm-sensorserrors.
Health monitoring
- BUG FIX: max network interface speed data collection was faulty, which resulted in false-positive alarms on systems with multiple interfaces using different speeds (the speed of the first network interface was used for all network interfaces). Now the interface speed is shown as a badge:
-
alerta.ionotifications got a few improvements -
BUG FIX:
conntrack_maxalarm has been restored (was not working due to an invalid variable name referenced)
Registry (my-netdata menu)
It has been refactored a bit to reveal the URLs known for each node and now it supports deleting individual URLs.
Packaging
-
openrcservice definition got a few improvements
Published by netdatabot almost 6 years ago
New to netdata? Check its demo: https://my-netdata.io
Hi all,
It has been 8 months since the last release of Netdata. We delayed releases a bit, but as you can see on these release notes, we were working hard to provide the best Netdata ever.
Thanks to synacktiv.com and red4sec.com, we fixed a number of vulnerabilities in the code base (check below), so release 1.11 of Netdata is the most secure Netdata so far. All users are advised to update to this version asap.
Netdata now has its own organization on GitHub. So, we moved from firehol/netdata to netdata/netdata! We also provide new docker images as netdata/netdata (the old ones are deprecated and are not updated any more).
Netdata community grows faster than ever. Currently netdata grows by +2k unique users and +1k unique installations per day, every day!
Contributions sky rocket too. To make it even easier for newcomers to get involved, we modularized all the code, now organized into a hierarchy of directories. We also moved most of the documentation, from the wiki into the repo. This is quite unique. Netdata is one of the first projects that organizes code and docs under the same hierarchy. Browse the repo; you will be surprised! Examples: data collection plugins, database, backends, web server, ARL, including benchmarks, etc.
Many thanks to all the contributors that help building, enhancing and improving a project useful and helpful to hundreds of thousands of admins, devops and developers around the world!
You rock!
@ktsaou
Automatic Updates broken
There was an accidental breaking change in the master repo of netdata.
All users that use automatic updates, are advised to run:
sudo sh -c 'cd /usr/src/netdata.git && git fetch --all && git reset --hard origin/master && ./netdata-updater.sh -f'
After that, netdata-updater will be able to update your netdata.
Stock config files are now in /usr/lib/netdata
We prepare netdata for binary packages. This required stock config files to be overwritten unconditionally when new netdata binary packages are installed. So, all config files we ship with netdata are now installed under /usr/lib/netdata/conf.d.
To edit config files, we have supplied the script /etc/netdata/edit-config that automatically moves the config file you need to edit to /etc/netdata and opens an editor for you.
New query engine
The query engine of netdata has been re-written to support query plugins. We have already added the following algorithms that are available for alarm, charts and badges:
-
stddev, for calculating the standard deviation on any time-frame. -
sesoremaorewma, for calculating the exponential weighted moving average, or single/simple exponential smoothing on any time-frame. -
des, for calculating the double exponential smoothing on any time-frame. -
cvorrsd, for calculating the coefficient of variation for any time-frame.
Fixed Security Issues
Identified by Red4Sec.com
-
CVE-2018-18836Fixed JSON Header Injection (an attacker could send\nencoded in the request to inject a JSON fragment into the response). -
CVE-2018-18837Fixed HTTP Header Injection (an attacker could send\nencoded in the request to inject an HTTP header into the response). -
CVE-2018-18838Fixed LOG Injection (an attacker could send\nencoded in the request to inject a log line ataccess.log). -
CVE-2018-18839Not fixed Full Path Disclosure, since these are intended (netdata reports the absolute filename of web files, alarm config files and alarm handlers).
Identified by Synacktiv
- Fixed Privilege Escalation by manipulating
apps.pluginorcgroup-networkerror handling. - Fixed LOG injection (by sending URLs with
\nin them).
Packaging
- Our official docker hub images are now at
netdata/netdata. These images are based on Alpine Linux for optimal footprint. We provide images fori386,amd64,aarch64andarmhf. - the supplied
netdata.servicenow allows configuring process scheduling priorities exclusively onnetdata.service(no need to changenetdata.conftoo). - the supplied
netdata.serviceis now installed in/usr/lib/systemd/system. - Stock netdata configurations are now installed in
/usr/lib/netdata/conf.dand a new script has been added to allow easily copying and editing config files:/etc/netdata/edit-config.
New Data Collection Modules
-
rethinkdbsfor monitoring RethinkDB performance -
proxysqlfor monitoring ProxySQL performance -
litespeedfor monitoring LiteSpeed web server performance. -
uwsgifor monitoring uWSGI performance -
unboundfor monitoring the performance of Unbound DNS servers. -
powerdnsfor monitoring the performance of PowerDNS servers. -
dockerdfor monitoring the health of dockerd -
puppetfor monitoring Puppet Server and Puppet DB. -
logindfor monitoring the number of active users. -
adaptec_raidandmegaclifor monitoring the relevant raid controller -
spigotmcfor monitoring minecraft server statistics -
boincfor monitoring Berkeley Open Infrastructure Network Computing clients. -
w1sensorfor monitoring multiple 1-Wire temperature sensors. -
monitfor collecting process, host, filesystem, etc checks from monit. -
linux_power_suppliesfor monitoring Linux Power Supplies attributes
Data Collection Orchestrators Changes
-
node.d.plugindoes not use thejscommand any more. -
python.d.pluginnow usesmonotonicclocks. There was a discrepancy in clocks used in netdata that resulted in a shift in time of python module after some time (it was missing 1 sec per day). - added
MySQLServicefor quickly adding plugins using mysql queries. -
URLServicenow supports self-signed certificates and supports custom client certificates. - all
python.d.pluginmodules that requiresudoto collect metrics, are now disabled by default, to avoid security alarms on installations that do not need them.
Improved Data Collection Modules
-
apps.pluginnow detects changes in process file descriptors, also fixed a couple of memory leaks. Its default configuration has been enriched significantly, especially for IoT. -
freeipmi.pluginnow supports optionignore-statusto ignore the status reported by given sensors.
statsd.plugin (for collecting custom APM metrics)
- The charting thread has been optimized for lowering its CPU consumption when several millions of metrics are collected.
-
setsnow report zeros instead of gaps when no data are collected -
histogramsandtimershave been optimized for lowering their CPU consumption to support several thousands of such metrics are collected. -
histogramshad wrong sampling rate calculations. -
gaugesnow ignore sampling rate when no sign is included in the value. - the minimum sampling rate supported is now 0.001.
- netdata statsd is now drop-in replacement for datadog statsd (although statsd tags are currently ignored by netdata).
proc.plugin (Linux, system monitoring)
- Unused interrupts and softirqs are not used in charts (this saves quite some processing power and memory on systems with dozens of CPU cores).
- fixed
/proc/net/snmpparsing ofIcmpMsglines that failed on a few systems. - Veritas Volume Manager disks are now recognized and named accordingly.
- Now netdata collects
TcpExtTCPReqQFullDropand re-organizes metrics in charts to properly monitor the TCP SYN queue and the TCP Accept queue of the kernel. - Many charts that were previously reported as IPv4, where actually reflecting metrics for both IPv4 and IPv6. They have been renamed to
ip.*. - netdata now monitors
SCTP. - Fixed BTRFS over BCACHE sector size detection.
- BCACHE data collection is now faster.
-
/proc/interruptsand/proc/softirqsparsing fixes.
diskspace.plugin (Linux, disk space usage monitoring)
- It does not
stat()excluded mount points any more (it was interfering with kerberos authenticated mount points). - several filesystems are now by default excluded from disk-space monitoring, to avoid breaking suspend on workstations.
freebsd.plugin (FreeBSD, PFSense, system monitoring)
-
loundrymemory is now monitored. -
system.netandsystem.packetscharts added that report the total bandwidth and packets of all physical network interfaces combined.
python.d.plugin PYTHON modules (applications monitoring)
-
web_logmodule now supports virtual hosts, reports http/https metrics, supportsquidlogs -
nginx_plusmodule now handles non-continuous peer IDs (bug fix) -
ipfsmodule is optimized, the use of its Pin API is now disabled by default and can enabled with a netdata module option (using the IPFS Pin API increases the load on the IPFS server). -
fail2banmodule now supports IPv6 too. -
cephmodule now checks permissions and properly reports issues -
elasticsearchmodule got better error handling -
nginx_plusmodule now uses upstreamip:portinstead of transient id to identify dimensions. -
redis, now it supports Pika, collects evited keys, fixes authentication issues reported and improves exception handling. -
beanstalk, bug fix for yaml config loading. -
mysql, the % of active connections is now monitored, query types are also charted. -
varnish, now it supports versions above 5.0.0 couchdb-
phpfpm, now supports IPv6 too. -
apache, now supports IPv6 too. icecast-
mongodb, added support for connect URIs postgress-
elasticsearch, now it supports versions above 6.3.0, fixed JSON parse errors -
mdstat, now collectsmismatch_cnt openvpn_log
node.d.plugin NODE.JS modules
-
snmpwas incorrectly parsing a new OID names as float. Fixed it.
charts.d.plugin BASH modules
-
nutnow supports naming UPSes.
Health Monitoring
- Added variable
$system.cpu.processors. - Added alarms for detecting abnormally high load average.
-
TCPSYNandTCPaccept queue alarms, replacing the old softnet dropped alarm that was too generic and reported many false positives. - system alarms are now enabled on FreeBSD.
- netdata now reads NIC speed and sets alarms on each interface to detect congestion.
- Network alarms are now relaxed to avoid false positives.
- New
bcachealarms. - New
mdstatalarms. - New
apcupsdalarms. - New
mysqlalarms. - New notification methods:
- rocket.chat
- Microsoft Teams
- syslog
- fleep.io
- Amazon SNS
Backends
- Host tags are now sent to Graphite
- Host variables are now sent to Prometheus
Streaming
- Each netdata slave and proxy now filter the charts that are streamed. This allows exposing netdata masters to third parties by limiting the number of charts available at the master.
- Fixed a bug in streaming slaves that randomly prevented them to resume streaming after network errors.
- Fixed a bug that on slaves that sent duplicated chart names under certain conditions.
- Fixed a bug that caused slaves to consume 100% CPU (due to a misplaced lock) when multiple threads were adding dimensions on the same chart.
- The receiving nodes of streaming (netdata masters and proxies) can now rate-limit the rate of inbound streaming requests received.
- Re-worked time synchronization between netdata slaves and masters.
API
- Badges that report time, now show
undefinedinstead ofnever.
Dashboard
- Added
UTCtimezone to the list of available time-zones. - The dashboard was sending some non-HTTP compliant characters at the URLs that made netdata dashboards break when used under certain proxies. Fixed.
Published by firehol-automation over 6 years ago
New to netdata? Check its demo: https://my-netdata.io
Posted on twitter, facebook, reddit r/linux,
Hi all,
Another great netdata release: netdata v1.10.0 !
This is a birthday release: netdata is now 2 years old !
Many thanks to all the contributors that help building, enhancing and improving a project useful and helpful for thousands of admins, devops and developers around the world! You rock!
- @ktsaou
At a glance
netdata now has a new web server (called static) with a fixed number of threads, providing a lot better performance and finer control of the resources allocated to it.
All dashboard elements (javascript) have been updated to their latest versions - this allows a smoother experience when embedding netdata charts on third party web sites and apps.
IMPORTANT: all users using older netdata are advised to update to this version. This version offers improved stability, security and a huge number of bug fixes, compared to any prior version of netdata.
new plugins
- BTRFS - monitor the allocations of BTRFS filesystems (yes, netdata can now properly detect when btrfs is going out of space)
- BCACHE - monitor the caching block layer that allows building hybrid disks using normal HDDs and SSDs
- Ceph - monitor ceph distributed storage
- nginx plus - monitor the nginx+ web servers
- libreswan - monitor IPSEC tunnels
- Traefik - monitor traefik reverse proxies
- icecast - monitor icecast streaming servers
- ntpd - monitor NTP servers
- httpcheck - monitor any remote web server
- portcheck - monitor any remote TCP port
- spring-boot - monitor java spring boot applications
- dnsdist - monitor dnsdist name servers
- hugepages - monitor the allocation of Linux hugepages
enhanced / improved plugins
- statsd
- web_log
- containers monitoring
- system memory
- diskspace
- network interfaces
- postgres
- rabbitmq
- apps.plugin
- haproxy
- uptime
- ksm
- mdstat
- elasticsearch
- apcupsd
- isc-dhcpd
- fronius
- stiebeleltron
new alarm notifications methods
- alerta
- IRC
And as always, hundreds more enhancements, improvements and bugfixes.
BTRFS monitoring
BTRFS space usage monitoring and related alarms.
netdata is able to detect if any of the space-related components (physical disk allocation, data, metdata and system) of BTRFS is about the become exhausted!
#3150 - thanks to @Ferroin for explaining everything about btrfs...

bcache monitoring
netdata now monitors bcache metrics - they are automatically added to any disk that is found to be a bcache disk.
ceph monitoring
New plugin to monitor ceph, the unified, distributed storage system designed for excellent performance, reliability and scalability (#3166 @lets00).
containers and VMs monitoring
- netdata now monitors
systemd-nspawncontainers. - netdata now renames charts of kubernetes containers.
-
virshis now called with-rto avoid prompting for password #3144 -
cgroup-networkis now a lot more strict, preventing unauthorized privilege escalation #3269 -
cgroup-networknow searches for container processes in sub-cgroups too - this improves the mapping of network interfaces to containers -
cgroup-networknow works even when there are novethinterfaces in the system
monitor ntpd
netdata can now monitor isc-ntpd. @rda0 did a marvelous job decoding NTP Control Message Protocol, collecting ntpd metrics in the most efficient way #3421, #3454 @rda0

btw, netdata also monitors
chronybut the chrony module of netdata is disabled by default, because certain CentOS versions ship a version of chrony that consumes 100% cpu when queried for statistics.
nginx plus web servers monitoring
Added python plugin to monitor the operation of nginx plus servers. The plugin monitors everything about nginx+, except streaming #3312 @l2isbad
libreswan IPSEC tunnels monitoring
netdata now monitors libreswan tunnels - #3204

remote HTTP/HTTPS server monitoring
netdata now has an httpcheck plugin (module of python.d.plugin), that can query remote http/https servers, track the response timings and check that the response body contains certain text #3448 @ccremer .

remote TCP port monitoring
netdata now has portcheck plugin (module of python.d.plugin), that can check any remote TCP port is open #3447 @ccremer

icecast streaming server monitoring
netdata now monitors icecast servers #3511 @l2isbad.
traefik reverse proxy monitoring
netdata now monitors traefik reverse proxies - #3557.
spring-boot monitoring
netdata can now monitor java spring-boot applications @Wing924


dnsdist
netdata now monitors dnsdist name servers - @nobody-nobody #3009
statsd
- statsd dimensions now support the options the external plugin dimensions support (currently the only usable option is
hiddento add the dimension, but make it hidden on the dashboard - a hidden dimension can participate in various calculations, including alarms). - statsd now reports the CPU usage of its threads at the netdata section.
- statsd metrics are logged to access.log the first time they are encountered.
- statsd metrics now accept the special value
zinitto allow them get initialized without altering their values (this is useful if you have rare metrics that you need to initialize when netdata starts). - statsd over TCP is now a lot faster - netdata can process up to 3.5mil statsd metrics / second using just one core. Added options to control the timeouts of TCP statsd connections.
- fixed the title and context of statsd private charts
- statsd private charts can now be hidden from the dashboard #3467
postgres
Several new charts have been added to monitor (#3400 by @anayrat):
- checkpointer charts
- bgwriter charts
- autovacuum charts
- replication delta charts
- WAL archive charts
- WAL charts
- temporary files charts
Also, the postgres plugin now also works when postgres is in recovery mode.
rabbitmq
- added Erlang run queue chart. This is useful in conjunction with the existing Erlang processes chart to get a better overall idea of what's going on in the Erlang VM. @arch273
- added rabbitmq information on the dashboard to complement the charts.
apps.plugin
netdata prior to this version was detecting the user and group of processes by examining the ownership of /proc/PID/stat. Unfortunately it seems that the owneship of files in /proc do not change when the process switches user. So, netdata could not detect the user and group of processes that started as root and then switched to another user.
Now netdata reads /proc/PID/status:
- process ownship information is now accurate
- eliminated the need to read
/proc/PID/statm(all the information of/proc/PID/statmis available in/proc/PID/status) - allowed netdata to read
VmSwap, so a new chart has been added to monitor the swap memory usage per process, user and group.
- fixed issue with unreasonable spikes on processes cpu on FreeBSD (there was a typo) #3245
- fixed issue with errors reported on FreeBSD about pid 0 #3099
The new plugin is 20% more expensive in terms of CPU. We tried hard to optimize it, but this is as good as it can get. Read about it at #3434 and #3436
haproxy
Added charts:
- hrsp_1xx, hrsp_2xx, hrsp_3xx, hrsp_4xx, hrsp_5xx, hrsp_other, hrsp_total for backands and frontends
- qtime, ctime, rtime, ttime metrics for backend servers
- backend servers In UP state
@ktarasz
uptime
netdata now uses /proc/uptime when CLOCK_BOOTTIME does not report the same uptime. In containers CLOCK_BOOTTIME reports the uptime of the host, while /proc/uptime reports the uptime of the container, so now netdata correctly reports the uptime of the container.
mdstat
various fixes to better monitor rebuild time and rate @l2isbad
KSM
- removed
to_scandimension - the savings % reported by netdata was less than the actual - fixed it.
elasticsearch
Added several charts for translog / indices segments statistics and JVM buffer pool utilization, which are often helpful when evaluating an elasticsearch node health #3544 @NeonSludge
memory monitoring
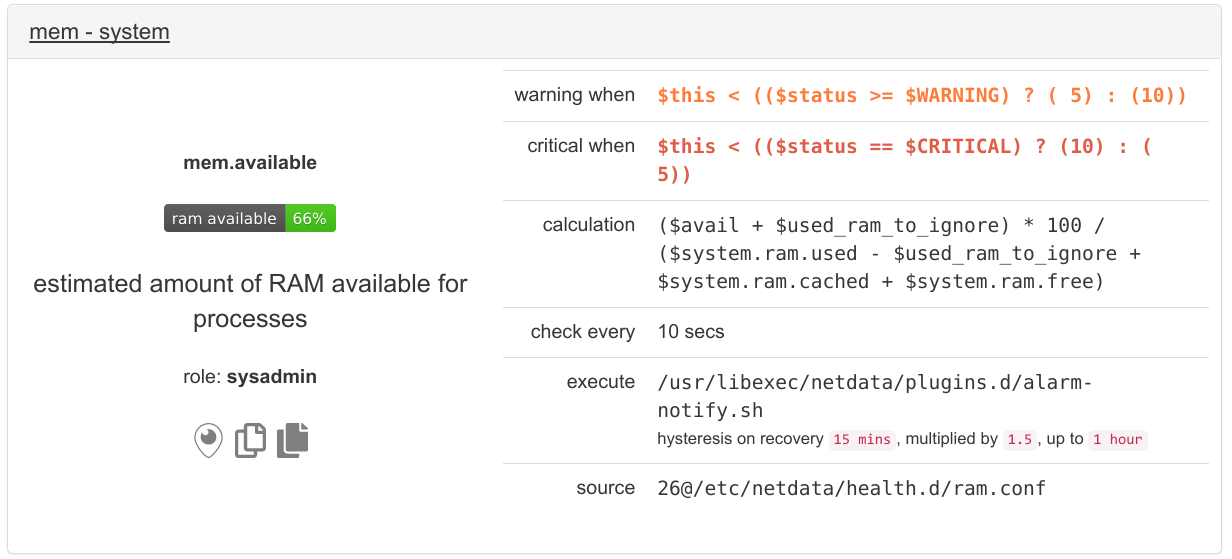
- treat slab memory as cached #3288 @amichelic
- added a new chart for monitoring the memory available for use, before hitting swap

- netdata now monitors Linux hugepages and transparent hugepages

- added hugepages monitoring #3462

diskspace monitoring
- support huge amounts of mountpoints #3258 - netdata was crashing with stack overflow due to recursion - now it is loop, so any number of mount points is supported
network monitoring
- moved tcp passive and active opens to a separate chart, to allow the TCP issues dimensions scale better by default #3238
- updated the information presented on TCP charts to match the latest v4.15 kernel source #3239
APC UPS
netdata now supports monitoring multiple APC UPSes.
ISC DHCPd
netdata now also supports monitoring IPv6 leases - @l2isbad
fronius
- added a new dimension
solar_consumption@ccremer - added alarms @ccremer
stiebeleltron
- added alarms @ccremer
web_log
Added web server response timings histogram #3558 @Wing924 .

python.d.plugin
- python.d.plugin can now start even if
/etc/netdata/python.d.confis missing @l2isbad - python.d.plugin now has an internal run counter @l2isbad
- the unicode decoding of the plugin has been fixed (#3406) @l2isbad
- the plugin now does not validate self-signed certificates @l2isbad
- the plugin can not revive obsolete charts @l2isbad
charts.d.plugin
charts.d.plugin BASH modules can now have custom number of retries in case of data collection failures #3524.
web server
- netdata now has a new internal web server that supports a fixed number of threads - we call it
static web server. This web server allows netdata to work around memory fragmentation (since the treads are fixed, the underlying memory allocators reuse the same memory arenas) and cpu utilization (we can control the number of threads that will be used by netdata). This is the default now. #3248 - now the static threads web server reports the CPU usage of each of its threads.
- the HTTP response headers now include the netdata version
dashboard
-
the print button now respects the URL path netdata is hosted.
-
dygraphs updated to the latest version - this fixes an issue that prevented netdata charts from being interactive under certain conditions
-
added dygraph theme
logscale#3283 -
fontawesome updated to version 5
-
d3 updated to the latest version (this broke c3 charts that require an older version)
-
added d3pie charts
-
custom dashboards can now have alarms for specific roles (all, none, one or more).
-
allow stacked charts to zoom vertically when dimensions are selected
-
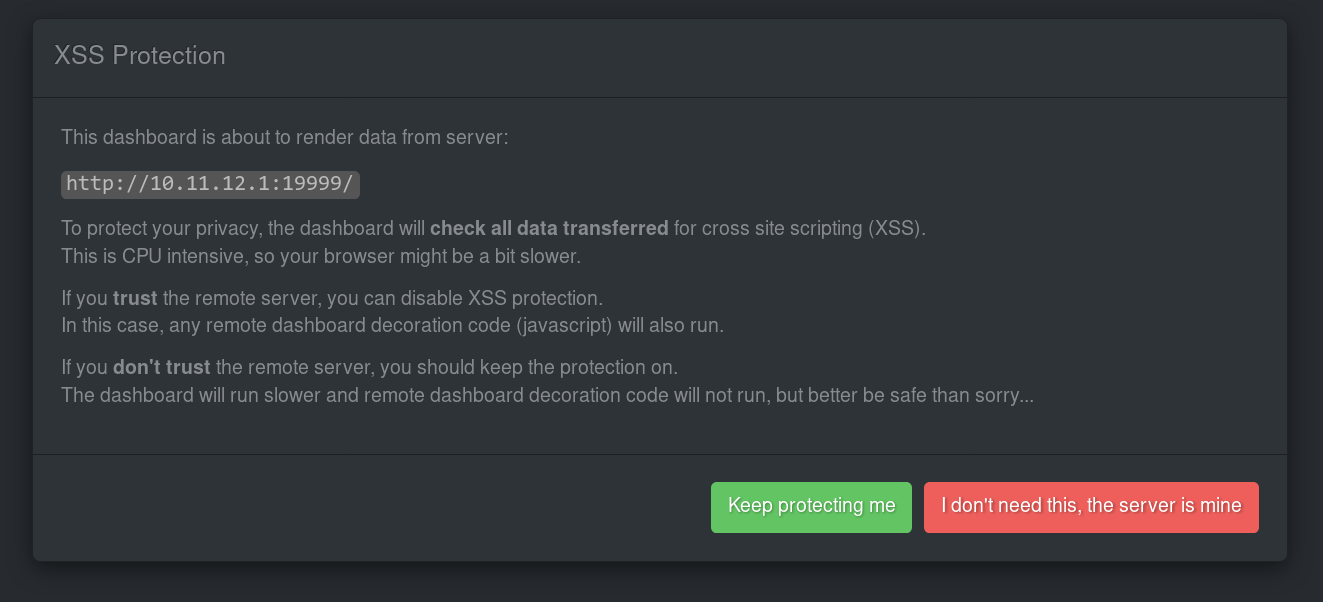
netdata now has a global XSS protection #3363
-
netdata now uses intersectionObserver when available #3280 - this improves the scrolling performance of the dashboard.
-
prevent date, time and units from wrapping at the charts legends #3286
-
various units scaling improvements #3285
-
added
data-common-colors="NAME"chart option for custom dashboards #3282. -
added wiki page for creating custom dashboards on Atlassian's Confluence.
-
prevented a double click on the charts' toolbox to select the text of the buttons.
-
fixed the alignment of dashboard icons #3224 @xPaw
-
added a simple js, called refresh-badges.js, to update badges on a custom web page
badges
netdata badges can now be scaled #3474


API
- added
gtimeparameter, for group time. This is used to request from netdata to return values in a different rate (i.e.gtime=60on aX/secdimension, will returnX/min). - fixed a rounding bug in JSON generation #3309
- the
dimensions=parameter now supports simple patterns #3170 and added option valuesmatch-idsandmatch-namesto control which matches are executed for dimensions.
alarms
-
system.swapalarms now send notifications with a 30 seconds delay, to work-around a kernel bug that incorrectly reports all swap as instantly used under containers #3380. -
added alarm to predict the time a mount point will run out of inodes #3566.
-
all system alarms are now ported to FreeBSD too #3337 @arch273
-
added alerta.io notifications @kattunga

-
added available memory alarm
-
removed unsupported html tags from hipchat notifications.
-
pagerduty notifications have been modified to avoid incident duplication #3549.
-
alarm definitions can now use both chart IDs and chart names (prior to this version only chart IDs were allowed).
-
curloptions (eg for disabling SSL certificates verification) foralarm-notify.shcan now be defined inhealth_alarm_notify.conf. -
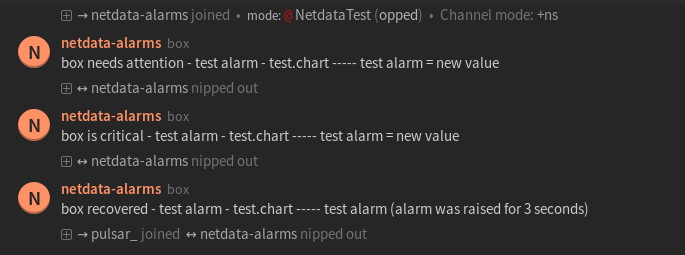
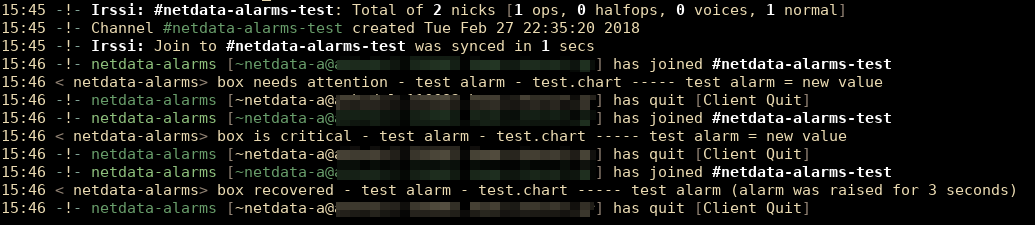
netdata can now send notifications to IRC channels #3458 @manosf
IRCCloud web client:
Irssi terminal client:
backends
- on netdata masters, allow filtering the hosts that will be sent to backends with
send hosts matching = *pattern. - improved connection error handling and added retries to allow netdata connect to certain backends that failed with
EALREADYorEINPROGRESS. - json backends now receive
host tags(the tags have to be formatted in a json friendly way) #3556. - re-worked the alarm that triggers when backend data are lost, to avoid flip-flops.
prometheus backends
- added URL option
timestamps=yes|noto/api/v1/allmetricsto support prometheus Pushgateway #3533 - added
netdata_infovariable with the version of netdata - renamed
netdata_host_tagstonetdata_host_tags_info(the old exists but is deprecated and will be removed eventually) - when prometheus uses
averagemetrics, netdata remembers the last access time the prometheus collected metrics, on a per host basis.
metrics streaming between netdata
- netdata masters and proxies now expose the version of the netdata collecting the metrics, not their own. So, now a netdata master shows on the dashboard and sends to backends the version of the netdata collecting the metrics #3538.
- added
stream.confoptionmultiple connections = accept | denyto allow or deny multiple connection for the same netdata host. The default remainsaccept, but it is likely to be changed tonoon future versions.
packaging
- added docker hub builds for aarch64/arm64 @justin8
- updated debian containers to use stretch @justin8
- added FreeBSD init file
- various installers fixes and improvements (make sure netdata is started, do not give information about features not supported on each operating system, allow non-root installations without errors, etc.)
- various installer fixes for FreeBSD and MacOS
-
netdata-updaterwas growing thePATHvariable on each of its runs - fixed it. - added
--acceptand--dont-start-itcommand line options tokickstart-static64.sh - netdata can be compiled with
long doublesupport (useful in embedded devices that don't support long double numbers) #3354 - fixed
netdata.specto allow building netdata on older and newer rpm based distros. Also added a script to build a netdata rpm - static netdata installer now tries to find the location of the SSL ca-certificates on a system and properly configured the static
curlprovided with this path. - the netdata updater starts netdata only if it was running
- added alpine dockerfile
other
- added global option
gap when lost iterationsto control the number of iterations that should be lost to show a gap on the charts. - various fixes/improvements related to netdata logs - the main change is that now netdata logs the thread name that logged the message, providing helpful insights about the thread that complained.
- re-worked the exit procedure of netdata to allow it cleanup properly - sometimes netdata was deadlocked during exit, waiting forever - now netdata always exits promptly #3184
- fixed compilation on ancient gcc versions
- netdata was always setting itself to the
idleprocess scheduling priority, even when it was configured to do otherwise. Fixed it #3523
New to netdata? Check its demo: https://my-netdata.io
Overview of netdata v1.9
-
snapshots
We can now save and load dashboard snapshots for any timeframe in any resolution. snapshots allow us to save artifacts, evidence, documentation of incidents, or just the raw data for postmortem analysis. -
highlighted time-frame
We can now highlight a selected time-frame on all dashboard charts. So, to quickly compare charts press ALT or CONTROL and select an area on one chart. The same area will be highlighted on all charts. -
export to PDF
We can now export netdata dashboards to PDF, for any timeframe with any detail. -
access lists (IP filtering)
We can now setup IP filtering atnetdata.conffor all functions of netdata (dashboard access, streaming, registry, badges, etc - no more iptables rules for protecting netdata). -
TCP overflows and connection drops
netdata can now detect TCP listening sockets overflows and connection drops, for any server running on the host (even the ones netdata is not aware of). -
libvirt VMs
netdata now detects libvirt network interfaces and moves them to VM section of the dashboard (it also supports.libvirt-qemunaming of cgroups). -
Units auto-scaling
netdata dashboards can now scale units (KB->MB->GB->TB, etc), on the fly. -
Units conversions
netdata dashboards can now convert units (eg. Celsius to Fahrenheit, seconds to HH:MM:DD, etc), on the fly. -
Multiple Timezones
netdata dashboards can now change timezone on the fly (yes, we can now compare charts with server logs). -
python.d.plugin rewritten
@l2isbad rewrote the whole of it, to add flexibility and support the latest netdata features! The new plugin supports the old python modules. -
better / faster dashboard scrolling
netdata now uses passive event listeners to detect page scrolling. This improved significantly the responsiveness of the dashboard (check your dashboard settings:syncscrolling is the fastest,asyncis closer to the older behavior). -
netdata now monitors couchdb, powerdns, beanstalkd and dnsdist !
-
netdata now detects redis background save failures
-
netdata can now send flock.com and kavenegar.com alarm notifications
and as always... dozens more improvements, enhancements, new features and bug fixes!
netdata dashboard snapshots !
Netdata can now export and import dashboard snapshots.
Snapshots are JSON files containing everything the dashboard needs to be rendered: charts and chart data.
They are exported as JSON files, to your computer. The saved snapshots can be loaded back on any netdata dashboard (even of different host). When importing, not network traffic is generated. The web browser loads the local file and renders an interactive dashboard to examine it.
The current visible timeframe of the dashboard is respected, so first align the dashboard to the timeframe required and the click "Export". The pop-up allows selecting the resolution of the export (its detail).
highlighted time-frame !
Press the ALT or CONTROL key and select a time-frame at a chart. An overlay will appear with the selected time-frame and all the charts will highlight the same region.
The highlighted time-frame:
- Is added to the URL hash, so that reloading the page keeps it
- Is propagated to other netdata servers, via the
my-netdatamenu - Is save in dashboard snapshots (and of course restored when they are loaded back)

Also, netdata charts can now be zoomed vertically (use the SHIFT key, like in zoom, but select the chart vertically):

netdata dashboards to PDF !
netdata dashboards can now be printed to PDF. Just click the 🖨️ icon on the dashboard.
The current visible timeframe of the dashboard is respected, so first align the dashboard to the timeframe required and the click "Print".

netdata now supports API access lists (IP filtering)
netdata can now check the client IPs connecting to it and deny/allow access based on your settings. No more iptables rules to control access to netdata.
All these settings are netdata simple patterns that are checked against the client IP (string matching - not subnet matching). localhost clients (IPv4, IPv6 and unix domain sockets) can be matched with localhost:
Global access control
-
[web].allow connections fromto match the clients' IPs allowed to connect to netdata. This has the same effect with iptables (but implemented at the application level - so clients will get connected, and disconnected immediately if they are not allowed access, without any response from netdata).
Dashboard access control
-
netdata.conf:[web].allow dashboard fromto match the clients' IPs that are allowed to access the dashboard (ie fetch static files and query netdata API). -
netdata.conf:[web].allow badges fromto match the clients' IPs that are allowed to access badges (the dashboard clients are allowed to access badges too, so this setting allows badges to clients that do not have access to the dashboard).
Streaming access control
-
netdata.conf:[web].allow streaming fromto match the the clients' IPs that are allowed to stream to stream metrics. -
stream.conf:[API_KEY].allow fromto match the clients' IPs allowed to push metrics for the given API KEY. -
stream.conf:[MACHINE_GUID].allow fromto match the clients' IPs allowed to push metrics for the specific machine.
netdata will also check the API keys supplied by slaves and proxies connected.
Other access lists
-
netdata.conf:[web].allow netdata.conf fromto limit the clients that can getnetdata.conf- by default netdata allows only private IPs. -
netdata.conf:[registry].allow fromto limit the clients allowed to access the registry (only when this netdata acts as a registry).
netdata detects TCP listening sockets overflowing or dropping connections
Added a new chart: ipv4.tcplistenissues with dimensions ListenOverflows and ListenDrops.
This chart detects if any listening TCP socket on the host, is overflown, or it drops connections. This is system-wide: any listening TCP socket, of any application.
The chart will not be shown if these kernel counters are zero. It will be enabled automatically if it is found non-zero at any point (it is collected via /proc/net/netstat every second). If you need to enable it even if it is zero, edit netdata.conf and set:
[plugin:proc:/proc/net/netstat]
	TCP listen issues = yes
Two alarms have been added, one for ListenOverflows and one for ListenDrops that detect if there is any overflow or drop in the last minute (they run every 10 seconds).
slack alarm for overflows:

slack alarm for drops:
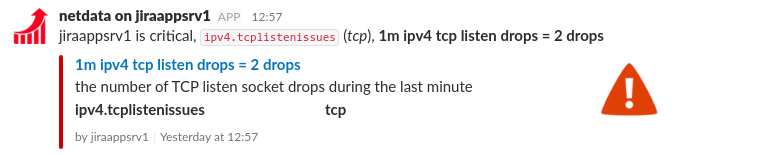
and the alarms configuration:
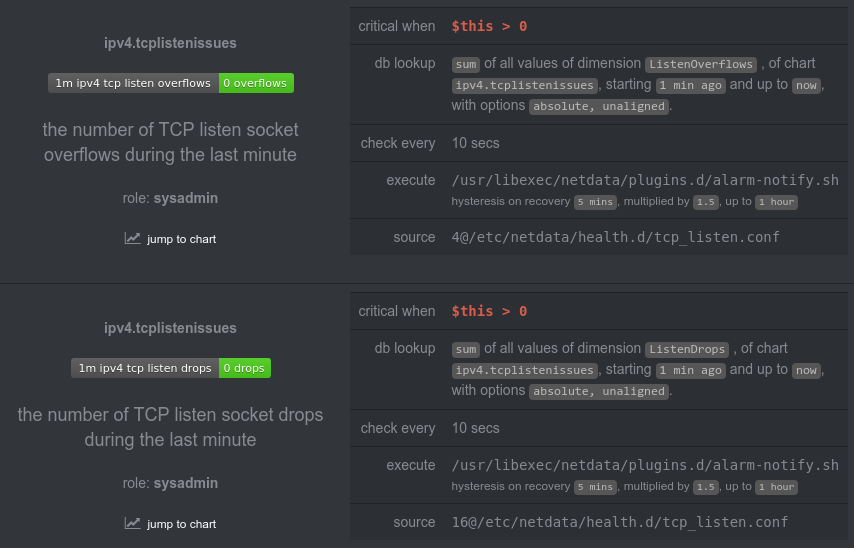
The alarms will automatically be attached when the chart is active.
The overflows dimension and alarm is supported on FreeBSD too.
/proc/net/sockstat and /proc/net/sockstat6
These files provide sockets statistics for all protocols.

netdata also adds 3 new alarms:
- too many tcp orphan sockets
- tcp memory that detects that the tcp stack is under memory pressure or close to giving memory errors
- too many tcp connections (for kernels that do not support dynamic allocation of connections)
Streaming
-
netdata proxies with more than 100 slaves, had a timing issue that caused them to crash randomly on slave reconnects. Parts of the code have been rewritten to get rid of the timing issue.
-
netdata slaves and proxies, now have a protection that ensures they will never use 100% CPU, even if the master is misbehaving.
-
expired orphaned hosts are now removed from the
my-netdatamenu of the dashboard. -
streaming functions can now be monitored via
access.log -
streaming now support IP filtering. So the entire streaming functionality, API keys and MACHINE GUIDs can be associated with one or more IPs or IP patterns.
-
streaming now transfers alarm variables too
python.d.plugin rewritten
@l2isbad did a marvelous job rewriting python.d.plugin. The new plugin:
-
supports option
autodetection_retry: SECONDS. When set to non-zero, the plugin will re-check the module every that many seconds. This solves the problem that netdata did not persist on collecting metrics from applications, if the application is not found running when netdata starts. By default is zero for all modules, so you need to enable it for all the applications you need it. -
got a rewrite of several functions, like logging, module configuration, chart and dimensions management.
-
the new URL service disables by default certificates checks, to allow self-signed certificates to work without configuration.
The new plugin is compatible with custom python modules developed for the previous version.
web_log plugin
-
custom regex now supports parsing hostnames and IPs @l2isbad
-
web_log now parses lines with error 408 (request timeout - these are a special case, since the request has not received by the web server, so the log line is incomplete) @l2isbad
-
now properly parses
resp_lengthwith value-@racciari
couchdb monitoring
CouchDB maintainer @wohali, submitted a couchdb plugin for netdata. The plugin monitors:
- database activity
- http response codes
- server operations
- per DB statistics


redis monitoring
2 charts have been added to monitor background save health status, bundled with 2 alarms that detect if background save has failed, or background save is slow (warn > 10 mins, crit > 20min). @l2isbad

Other new and enhanced plugins
-
netdata now monitors PowerDNS, @l2isbad
-
netdata now monitors beanstalkd, @l2isbad
-
netdata now monitors dnsdist, @nobody-nobody
-
disks under Linux are renamed using
/dev/disk/by-label. An option has been added at netdata.conf to also allow renaming based on/dev/disk/by-id. -
chronyis now disabled by default, because there have been reports thatchronycenters an infinite loop in CentOS and RHEL. -
tomcatimprovements to support flavors of the tomcat server @Wing924 -
zfson FreeBSD now monitors ZFS TRIM statistics -
disks monitoring charts on FreeBSD got a lot more FreeBSD related dimensions.
-
added CPU frequency charts on FreeBSD (Linux already had them).
-
chart
system.io(the total system Disk I/O) is now calculated by aggregating the reads and writes of all physical disks. The previoussystem.iochart (that is based onpgpginandpgpgoutfrom/proc/vmstat) is now namedsystem.pgpgio. The key difference is that the newsystem.ionow sees ZFS I/O, and it also correctly and accurately sums the real disk bandwidth of RAID arrays. -
chart
system.net(the total system network bandwidth) is now calculated by aggregating the bandwidth of all physical network interfaces and is common for both IPv4 and IPv6. -
tc(QoS) charts now sort the dimensions on the legends, the same waytcreports them. -
postgresversions <= 10 the WAL directory was namedpg_xlog'and from 10 upwards has been renamed topg_wal@facetoe -
mysql(and mariadb) got new charts for galera replication @spinitron -
openvpn_logimprovements @l2isbad -
smartdimprovements @l2isbad -
varnishmodule has been rewritten @l2isbad -
mdstatregex fix @l2isbad -
smartd_logimprovements @l2isbad -
dns_query_timeimprovements @wungad -
isc_dhcpdimprovements @wungad -
freeipmi.plugingot a command line option (can be given at netdata.conf) to ignore certain sensor IDs that are faulty. -
freeradiusimprovements @wungad -
node.d.pluginbugfixes
Plugins protocol enhancements
- netdata now supports multiple plugin directories. The setting is the same in
netdata.conf,plugins directory = "DIRECTORY1" "DIRECTORY2" ..., up to 20 directories. By default netdata sets:
[global]
      plugins directory = "/usr/libexec/netdata/plugins.d" "/etc/netdata/custom-plugins.d"
-
netdata now supports alarms variables.
Each plugin can now define host global and chart local variables with static values, that can be used in alarms' expressions. So, hosts and charts can now have any number of static values associated with them (eg. an application server may expose its max connections limit), and these static values can be used to trigger alarms (eg. the current connections, is compared to the max connections variable). The whole setup allows alarm templates to use this feature (eg each netdata can maintain different such variables for each server it monitors).
Alarm variables are propagated to upstream netdata servers.
O/S - distro support
-
added init file for SLC 6.9 and CloudLinux Server release 6.9
-
packages installer was incorrectly detecting all python versions as version 2.
-
a
makeselfbug that prevented the static netdata binaries from being installed onbusyboxsystems, has been fixed. -
openrc startup script (gentoo, alpine) had hardcoded the path to netdata. This affected all static-64bit builds when installed on these distros. Fixed.
-
the static 64bit installer now downloads netdata.conf, much like the git installer does.
-
openrc / gentoo init improvements @candrews
-
enabled support for macOS versions 10.5+ (10.11 was working already) @vlvkobal
-
enabled support for FreeBSD 12 @vlvkobal
-
fixed a crash on macOS hosts with empty disk names.
-
added
Dockerfile.armv7hffor running netdata under docker on ARM v7 machines @justin8
Dashboard improvements
-
hover selection of charts is now faster on all browsers. Perfect on Chrome, Firefox and Opera. Quite usable on Edge.
-
the dashboard is now fixed when a modal is open, preventing scrolling the page.
-
the dashboard now uses fontawesome 5.0.1 for icons.
-
the chart names can now be searched with browser control-F (find in page). netdata lazy loads all charts for it was impossible to search of a chart. Now the charts are searchable. This is important on dashboards with several hundreds of statsd charts, because all these charts appear under the same section.
-
netdata now detects libvirt VM network interfaces and moves them to the VM section of the dashboard. The same functionality already exists for containers.

-
Show the context of each chart. The
contextis used in alarm templates. (hover on the date of the chart)
-
Show the resolution of the chart. (hover on the time of the chart)

-
The dashboard now adds a tooltip at the date of the charts, to show the plugin and its module that collects each chart.
-
The dashboard should now put a lot less CPU pressure on the browser when the page does not have focus.
automatic units scaling
The dashboard does dynamic units scaling, on the fly ! It converts:
- network bandwidth (
kilobits/stomegabits/sorgigabits/s) - input/output bandwidth (
kilobytes/stomegabytes/sorgigabytes/s, similarly forKB/s) - memory sizes (
MBtoKB,GBorTB) - disk sizes (
GBtoMBorTB)
Chart units dynamically adapt based on the value of the selected dimension too:

Custom dashboards can give data-desired-units="UNITS" and netdata will automatically convert the presented values to the desired units. UNITS can be any of the supported one, or auto for auto-scaling based on the values, or original to show the original units maintained by the netdata server.
units conversions
The dashboard now supports units conversions. Currently it converts:
temperatures from Celsius to Fahrenheit

seconds to human readable duration DDd:HH:MM:SS
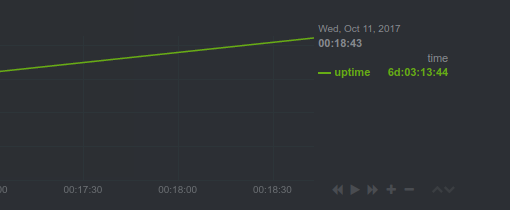
timezone conversions
netdata can now convert all dates presented to any timezone. Traditionally netdata presented all charts at the timezone of the viewer. This allowed homogeneous central administration of systems that are installed all over the world. However, this was inefficient when we needed to compare the information presented on the dashboard, with the log files of the servers.
So, now netdata can present the charts on any timezone. The netdata server auto-detects the timezone of the server and new dashboard settings have been added to allow this conversion.
If autodetection of the servers timezone fails, the configuration option [global].timezone has been added in netdata.conf to set it. Also, the dashboard itself allows the viewers to configure the timezone (it is saved at browser local storage, so this has to be set just once per viewer).
new dashboard options
To support all the above, the dashboard settings got a new tab, with all the required options:

statsd improvements
-
statsd metrics can now be added to statsd synthetic charts using patterns. No need to add a
dimensionline for each statsd metric to be added. netdata will also extract the wildcarded part of the metric name and use that one for the dimension name. -
dimensions added to statsd synthetic charts, can automatically be renamed using a dictionary. Each synthetic charts application has its own dictionary of name - value pairs, which is used to automatically rename statsd metrics when they are added to synthetic charts.
-
statsd timers and histograms now report zeros when nothing is collected
Badges improvements
-
fixed a bug in netdata badges that was incorrectly matching zero values with the
nullcolor condition. -
added API option
display_absoluteto allow badges use the signed value for color evaluation, but present the absolute value.
Other Alarm and Alarm Notifications Improvements
-
warning emails sent by netdata, are now a little bit more orange (they were a bit green'sh).
-
added flock.com notifications @tvarsis
-
added kavenegar.com support for SMS notifications @vahit
-
fixed a bug in email notifications that was triggering a corrupted MIME match by anti-spam solutions.
-
pushbullet notifications now track the devices, so that per device filtering at pushbullet is possible. Also improved the formatting a bit. @user501254
-
pushover notifications fixes (the priority of warnings was set incorrectly)
-
alarms can now use variables like this
${variable with spaces or +, -, *, / in it}. So, alarms can now use dimension names with any character in them.
Other Improvements
-
access.loghas been refactored to support monitoring all netdata operations -
inodes monitoring is now by default disabled for mount points based on filesystems that do not have a maximum inode threshold (such as
cephfs). -
rabbitmqhas been added toapps_groups.confso thatapps.pluginnow monitors (cpu, memory, disk I/O, sockets, etc) for rabbitmq instances. -
several email and log management apps have been added to
emailandlogstargets ofapps_groups.conf, @Flums -
cephtarget added toapps_groups.confto allow netdata monitor Ceph - the unified, distributed storage system, @k0ste -
refactored several internal data collection plugins to eliminate a few hundreds of index lookups per second.
-
netdata.confsettings that are loaded from disk, but were the same with the default ones, were generated commented when the server was asked to give its config. Now all loaded settings are generated uncommented. -
netdata simple patterns can now extract the the wildcarded part of the string they match (used in statsd synthetic charts)
-
netdata simple patterns can allow escaping spaces by prefixing them with a backslash.
New to netdata? Check its demo: https://my-netdata.io
netdata v1.8.0 released.
This release focuses on metrics streaming improvements and containers monitoring.
As always, this netdata is the fastest and the more stable netdata ever! Update now!
To install or update netdata, click here!
key streaming improvements
bug fix: streaming slaves consuming 100% CPU
netdata, as a slave, was not handling all the error cases properly, resulting in 100% cpu utilization of a single core, under certain conditions. Especially under FreeBSD and macOS slaves, these conditions were always met, so using FreeBSD or macOS as netdata slaves, was completely broken.
bug fix: missing alarm notifications on netdata masters
netdata was incorrectly messing cached alarm state data between the alarms of the mirrored hosts, resulting in alarm notifications not dispatched under certain conditions. This was affecting only netdata masters (ie. netdata servers with more than one host databases, with health monitoring enabled). The alarms were generated and were visible at the dashboards, but the notifications were not always sent.
bug fix: streamed charts with duplicate names
There was a minor issue with charts that were created with name aliases. When these charts were streamed from netdata slaves to netdata masters, they ended up with duplicate chart names (ie instead of type.name they had type.type.name).
key containers monitoring improvements
-
Container network interfaces are now moved to the container section and they are rendered from the container view point (i.e.
sent= what the container sent) - no moreveth*garbage on the dashboard. -
The interfaces also appear as
eth0(or whatever the container sees) and they are inside the container section of the dashboard. netdata maps eachveth*interface to the right container, using plaincgroupsfeatures, so this works for all container managers (docker, lxc, etc). -
Eliminated the nested containers shown under certain versions of
lxc. -
Also, containers and VMs now have summary gauges on the dashboard

key plugins improvements
python.d.plugin now supports HTTP keep-alive
netdata now uses urllib3 (shipped with netdata for both python v2 and v3) for URLService based plugins.
This enables HTTP keep-alive on all connections, which allows netdata to have permanent connections to third party web applications.
Fixed by @l2isbad
compatibility enhancements
- better support for Oracle Linux, by @schindlerd
- better support for Alpine Linux
- various fixes at the build procedure for macOS
-
fpingcan now run as non-root, in static binary netdata packages
netdata generic enhancements
-
netdata can now listen on UNIX domain sockets (
.sockfiles). This allows a local web server and netdata to communicate bypassing the network stack (for netdata setbind to = unix:/path/to/netdata.sock- this option supports multiple arguments, so netdata can listen to multiple unix sockets and tcp sockets, at the same time). -
netdata was assuming that the JSON representation of a chart would at most be 1024 bytes, and it was generating corrupted JSON output when any chart was exceeding that limit. Removed the limitation (ie. now there is no limit).
-
netdata was crashing while starting, if no usable disks were found.
-
systemd
netdata.servicenow allows setting negative netdata OOM score and restarts netdata if it crashes. The newnetdata.serviceis not automatically installed when updating netdata. Either delete/etc/systemd/system/netdata.serviceand then update/re-install netdata, or copy the file by hand. -
minor fixes at the installer, by @vincele
new plugins
- Added Intel CPU temperature charts on FreeBSD and macOS, by @vlvkobal
- Added CPU thermal throttling charts on Linux (useful on physical servers and possibly laptops)
- Added
chronyplugin, by @domschl - Added Stiebel Eltron plugin to collect metrics from heat pumps and hot water installations from Stiebel Eltron ISG @BrainDoctor
improved plugins
-
web_logbugfixes, enhancements and optimizations (includingsquidlogs), by @l2isbad -
web_lognow enables parsing HTTP/2 logs incustom_log_format, by @Funzinator -
redisbugfixes, by @l2isbad -
haproxybugfixes, by @l2isbad -
elasticsearchbugfixes and optimizations, by @l2isbad -
rabbitmqbugfixes and optimizations, by @l2isbad -
mdstatbugfixes, by @JeffHenson -
tomcatimprovements, by @Wing924 -
mysqlimprovements, by @alibo and @l2isbad -
dovecotimprovements -
postgresimprovements, by @facetoe -
cpufreqfixed a bug that preventedaccuratereporting of CPU frequencies.accurateworks with theacpi-cpufreqdriver and calculates the average CPU clock of the CPUs utilizing the accounting per frequency, as reported by the kernel, by @tycho -
cpuidleperformance improvements (faster under load) by @tycho -
fail2banbugfixes, by @l2isbad -
SNMPplugin new uses latestnet-snmpand the corrupted 64 bit counters encountered under certain node.js version is now fixed.
dashboard improvements
-
easypiechartsandgaugescan now render arbitrary ranges and animate clock wise or counter clock wise. -
traditionally netdata was using 1024 bits = 1 kilobit. It is fixed: 1000 bits = 1 kilobit.
-
netdata charts should now work on wordpress pages.
alarms and notifications
-
alarm-notify.shnow supports debug mode, showing the exact commands it runs to send notifications, whenexport NETDATA_ALARM_NOTIFY_DEBUG=1 -
alarm-notify.shnow supports setting the sender email address of the emails it sends. -
emails sent by
alarm-notify.shnow include headers to reduce the possibility of them being scored as spam, by @Ferroin -
network related alarms got new thresholds and improved badges
-
netdata now detects if the system has been suspended and pauses all alarms for 60 seconds on resume, to prevent false alarms (no more false alarms on laptops when they resume).
-
netdata alarms now support filtering based on hostname and O/S (linux, freebsd, macos). This means that netdata masters, can now support alarms for slaves of any O/S (i.e. a Linux netdata master can handle alarms for a FreeBSD slave).
-
netdata slack notifications now show the host sent the alarm. In the image below, the alarm is about
bangalore, and is sent bynetdata-build-server(at the lower left corner):
statsd
- the number of fractional points supported by statsd is now configurable (1 to 7).
- 95th percentile calculation on statsd histograms and timers, was incorrectly averaging the values. It is now fixed.
- statsd metrics with non ASCII text were processed by the statsd server, but were breaking JSON data generated by netdata. Fixed it by replacing all invalid characters.
Published by philwhineray over 7 years ago
New to netdata? Check its demo: https://my-netdata.io
This is release v1.7 of netdata.
netdata is still spreading fast: we are at 320.000 users and 132.000 servers! Almost 100k new users, 52k new installations and 800k docker pulls since the previous release 4 and a half months ago! netdata user base grows at about 1000 new users and 600 new servers per day! Thank you! You are awesome!
The next release (v1.8) will be focused on providing a global health monitoring service, for all netdata users, for free! Read more about it here. We need supporters for this cause. Join us!
highlights of netdata v1.7
-
netdata is now a (very fast) fully featured statsd server and the only one with automatic visualization: push a statsd metric and hit F5 on the netdata dashboard: your metric visualized. It also supports synthetic charts, defined by you, so that you can correlate and visualize your application the way you like it.
-
netdata got new installation options - it is now easier than ever to install netdata - we also distribute a statically linked netdata x86_64 binary, including key dependencies (like
bash,curl, etc) that can run everywhere a Linux kernel runs (CoreOS, CirrOS, etc). -
metrics streaming and replication has been improved significantly. All known issues have been solved and key enhancements have been added. headless collectors and proxies can now send metrics to backends when
data source = as collected. -
backends have got quite a few enhancements, including host tags, metrics filtering at the netdata side and sending of chart and dimension names instread of IDs; prometheus support has been re-written to utilize more prometheus features and provide more flexibility and integration options. IF YOU UPDATE FROM NETDATA 1.6 PLEASE CHECK YOUR DASHBOARDS, SINCE MANY METRICS HAVE CHANGED NAMES.
-
netdata now monitors ZFS (on Linux and FreeBSD), ElasticSearch, RabbitMQ, Go applications (via
expvar), ipfw (on FreeBSD 11), samba, squid logs (withweb_logplugin!). -
netdata dashboard loading times have been improved significantly (hit F5 a few times on a netdata dashboard - it is now amazingly fast), to support dashboards with thousands of charts.
-
netdata alarms now support custom hooks, so you can run whatever you like in parallel with netdata alarms.
-
As usual, this release brings dozens more improvements, enhancements and compatibility fixes.
netdata is now a fully featured statsd server
netdata is now a fully featured statsd server. It can collect statsd formatted metrics, visualize them on its dashboards, stream them to other netdata servers or archive them to backend time-series databases.
netdata statsd is fast. It can collect more than 1.200.000 metrics per second on modern hardware, more than 200Mbps of sustained statsd traffic. netdata statsd is inside netdata. This provides a distributed statsd implementation.
netdata also supports statsd synthetic charts: You can create dedicated sections on the dashboard to render the charts. You can control everything: the main menu, the submenus, the charts, the dimensions on each chart, etc.
Read more about netdata statsd
counters
- Scope: count the events of something (e.g. number of file downloads)
- Format:
name:INTEGER|corname:INTEGER|Corname|c - statsd increments the counter by the
INTEGERnumber supplied (positive, or negative).

gauges
- Scope: report the value of something (e.g. cache memory used by the application server)
- Format:
name:FLOAT|g - statsd remembers the last value supplied, and can increment or decrement the latest value if
FLOATbegins with+or-.

histograms
- Scope: statistics on a size of events (e.g. statistics on the sizes of files downloaded)
- Format:
name:FLOAT|h - statsd maintains a list of all the values supplied and provides statistics on them.

The same chart with sum unselected, to show the detail of the dimensions supported:

meters
This is identical to counter.
- Scope: count the events of something (e.g. number of file downloads)
- Format:
name:INTEGER|morname|mor justname - statsd increments the counter by the
INTEGERnumber supplied (positive, or negative).

sets
- Scope: count the unique occurrences of something (e.g. unique filenames downloaded, or unique users that downloaded files)
- Format:
name:TEXT|s - statsd maintains a unique index of all values supplied, and reports the unique entries in it.

timers
- Scope: statistics on the duration of events (e.g. statistics for the duration of file downloads)
- Format:
name:FLOAT|ms - statsd maintains a list of all the values supplied and provides statistics on them.

The same chart with the sum unselected:

dashboard improvements
There have been significant optimizations to the loading times of the dashboard. The dashboard loads instantly now, even when there are several hundreds of charts in it (hit F5 on the dashboard - it is super fast).
For those who know: we eliminated most browser reflows, by refactoring the way the charts are initialized and splitting initialization in 2 phases. Unfortunately we had to re-shape gauge and easypiecharts, so pay some attention to your custom dashboards after updating.
We now use natural sorting on the dashboard elements (i.e. instead of 1, 10, 2, 3 we get 1, 2, 3, 10).
There have been dozens of performance improvements on the netdata dashboard. Like all the previous releases, this release makes netdata the fastest netdata so far!
new installation methods
- Single line installation on Linux
- Static 64bit packages for Linux
- Improved support for Red Hat Enterprise Linux @racciari,
- Improved support for Amazon Machine Image
- Improved support for Centos @n0coast
- Many more installer/updater improvements @nielsAD, @mfurlend
Streaming
- improved self cleanup of obsolete charts and hosts at a central netdata.
- host tags are now propagated from netdata to netdata while streaming metrics.
- log error when multiple clients are streaming the metrics of the same host.
- dozens more streaming improvements and bugfixes.
Backends
- New prometheus backend, supporting all the features of the others backends netdata supports. The new format changed the names of metrics, so if you use grafana or other tools you will have to update your queries.
- Prometheus and opentsdb now support host tags (advanced ephemeral nodes monitoring)
- Metrics sent to backends with data source
average,sumorvolume(from the netdata database) are now more accurate. - Added
contrib/nc-backend.sh, a script that can act as a fallback backend for graphite, opentsdb and compatibles. - netdata nodes without a database (slaves and proxies) can now send
as collectedmetrics to backends.
New and improved plugins
-
Go apps monitoring via
expvar! @kralewitz - ElasticSearch monitoring ! @l2isbad
- RabbitMQ monitoring ! @l2isbad
- ipfw monitoring under FreeBSD 11 ! @vlvkobal
- ZFS monitoring under FreeBSD (@vlvkobal) and Linux !
- samba monitoring ! @ntlug
-
web_logplugin can now monitor squid logs too ! @l2isbad -
web_logplugin can now monitor apache cache logs too (removed oldapache_cacheplugin) @l2isbad - many more
web_logimprovements -web_logis now a lot more powerful! @l2isbad -
python.d.pluginLogServicenow supports monitoring web log files matching a pattern @l2isbad - disk monitoring under Linux now utilizes
/dev/mappernames. It also has improved docker compatibility. -
haproxyimprovements @l2isbad -
dns_query_timeplugin to monitor the response time of nameservers @l2isbad - Fronius Solar @BrainDoctor
- better support for monitoring Proxmox/qemu @efaden and libvirt/qemu VMs
-
cpufreqimprovements @l2isbad -
smartd_logimprovements @pkoenig10 -
bind_rndcrewritten @l2isbad -
lighttpdimprovements (part of theapacheplugin) -
isc_dhcpdimprovements @l2isbad -
fpingimprovements -
apps.pluginimprovements (added many more applications to monitor, notably hadoop and friends, improved compatibility) -
freeipmiimprovements -
mdstatimprovements @l2isbad -
mysqlimprovements @alibo -
redisimprovements @l2isbad -
postgresrds fixes @facetoe -
fail2banimprovements @l2isbad -
idlejitterrewritten -
openvpnimprovements @l2isbad -
numaimprovements @Benje06
New and improved alarms
-
alarm-notify.shnow supports custom notification methods (you can hook whatever you like to netdata alarms). - email notifications are now multipart (have both HTML and text versions in them)
- low memory alarm now excludes ZFS ARC.
- improved discord notifications.
- improved telegraf notifications @alibo
-
lighttpdalarm -
mongodbalarm @jnogol
Other improvements
- memory mode
ramutilizes KSM (kernel memory deduper). - many memory mode
mapimprovements for faster operation with huge databases. - netdata is now even faster on FreeBSD, thank to several optimization made by @vlvkobal
- netdata can now be compiled with
clang, even on FreeBSD - netdata can now be compiled on FreeBSD 10.3
Published by philwhineray over 7 years ago
New to netdata? Check its demo: https://my-netdata.io


Release announced on twitter, hacker news, reddit r/linux, reddit r/sysadmin, reddit r/linuxadmin, reddit r/freebsd reddit r/devops reddir r/homelab facebook
birthday release: 1 year netdata
netdata was first published on March 30th, 2016.
It has been a crazy year since then:
Central netdata is here!
This is the first release that supports real-time streaming of metrics between netdata servers.
netdata can now be:
- autonomous host monitoring (like it always has been)
- headless data collector (collect and stream metrics in real-time to another netdata)
- headless proxy (collect metrics from multiple netdata and stream them to another netdata)
- store and forward proxy (like headless proxy, but with a local database)
- central database (metrics from multiple hosts are aggregated)
metrics databases can be configured on all nodes and each node maintaining a database may have a different retention policy and possibly run (even different) alarms on them.
There are 4 settings that control what netdata can be:
-
[global].memory modeinnetdata.conf, controls if a netdata will maintain a local database and the type of it. For more information check Running a dedicated central netdata server. -
[web].modeinnetdata.conf, controls if netdata will expose its API, and the type of web server to enable (single or multi-threaded). Check netdata.conf configuration for streaming. -
[stream].enabledinstream.conf, controls if netdata will stream its metrics to another netdata. Check stream.conf for sending metrics. -
[API KEY].enabledinstream.conf, controls if netdata will accept metrics from other netdata. Check stream.conf for receiving metrics.
Using the above, we support a lot of different configurations, like these:
| target | memorymode | webmode | streamenabled | send tobackend | localalarms | localdashboard |
|---|---|---|---|---|---|---|
| headless collector | none |
none |
yes |
not possible | not possible | no |
| headless proxy | none |
not none
|
yes |
not possible | not possible | no |
| proxy with db | not none
|
not none
|
yes |
possible | possible | yes |
| central netdata | not none
|
not none
|
no |
possible | possible | yes |
monitoring ephemeral nodes
netdata now supports monitoring autoscaled ephemeral nodes, that are started and stopped on demand (their IP is not known).
When the ephemeral nodes start streaming metrics to the central netdata, the central netdata will show register them at my-netdata menu on the dashboard, like this:
You can see this live at https://build.my-netdata.io (this server may not always be available for demo).
For more information check: monitoring ephemeral nodes.
monitoring ephemeral containers and VM guests
netdata now cleans up container, guest VM, network interfaces and mounted disk metrics, disabling automatically their alarms too.
For more information check monitoring ephemeral containers.
apps.plugin ported for FreeBSD
Vladimir Kobal has ported apps.plugin to FreeBSD.
netdata can now provide Applications, Users and User Groups under FreeBSD too:
Also, the CPU utilization of netdata under FreeBSD, is now a lot less compared to netdata v1.5.
See it live at our FreeBSD demo server.
web_log plugin
Ilya Mashchenko has done a wonderful job creating a unified web log parsing plugin for all kinds of web server logs. With it, netdata provides real-time performance information and health monitoring alarms for web applications and web sites!
Requests by http status:

Requests by http status code family:

Requests by http status code:

Requests bandwidth:

Requests timings:

URL patterns of interest (you configure the patterns):

Requests by http method:

Requests by IP version:

Number of unique clients:

and a lot more, including alarms:
| alarm | description | minimumrequests | warning | critical |
|---|---|---|---|---|
1m_redirects |
The ratio of HTTP redirects (3xx except 304) over all the requests, during the last minute. Detects if the site or the web API is suffering from too many or circular redirects. (i.e. oops! this should not redirect clients to itself) | 120/min | > 20% | > 30% |
1m_bad_requests |
The ratio of HTTP bad requests (4xx) over all the requests, during the last minute. Detects if the site or the web API is receiving too many bad requests, including 404, not found. (i.e. oops! a few files were not uploaded) |
120/min | > 30% | > 50% |
1m_internal_errors |
The ratio of HTTP internal server errors (5xx), over all the requests, during the last minute. Detects if the site is facing difficulties to serve requests. (i.e. oops! this release crashes too much) | 120/min | > 2% | > 5% |
5m_requests_ratio |
The percentage of successful web requests of the last 5 minutes, compared with the previous 5 minutes. Detects if the site or the web API is suddenly getting too many or too few requests. (i.e. too many = oops! we are under attack)(i.e. too few = oops! call the network guys) | 120/5min | > double or < half | > 4x or < 1/4x |
web_slow |
The average time to respond to requests, over the last 1 minute, compared to the average of last 10 minutes. Detects if the site or the web API is suddenly a lot slower. (i.e. oops! the database is slow again) | 120/min | > 2x | > 4x |
1m_successful |
The ratio of successful HTTP responses (1xx, 2xx, 304) over all the requests, during the last minute. Detects if the site or the web API is performing within limits. (i.e. oops! help us God!) | 120/min | < 85% | < 75% |
For more information check: the spectacles of a web server log file.
backends
netdata can now archive metrics to JSON backends (both push, by @lfdominguez, and pull modes).
IPMI monitoring
netdata now has an IPMI plugin (based on freeipmi) for monitoring server hardware.
The plugin creates (up to) 8 charts, based on the information collected from IPMI:
- number of sensors by state
- number of events in SEL
- Temperatures CELCIUS
- Temperatures FAHRENHEIT
- Voltages
- Currents
- Power
- Fans
It also supports alarms (including the number of sensors in critical state):

For more information, check monitoring IPMI.
New Plugins
Ilya Mashchenko builds python data collection plugins for netdata at an wonderfull rate! He rocks!
- web_log for monitoring in real-time all kinds of web server log files @l2isbad
- freeipmi for monitoring IPMI (server hardware)
- nsd (the name server daemon) @383c57
- mongodb @l2isbad
- smartd_log (monitoring disk S.M.A.R.T. values) @l2isbad
Improved Plugins
- nfacct reworked and now collects connection tracker information using netlink.
- ElasticSearch re-worked @l2isbad
- mysql re-worked to allow faster development of custom mysql based plugins (MySQLService) @l2isbad
- SNMP
- tomcat @NMcCloud
- ap (monitoring hostapd access points)
- php_fpm @l2isbad
- postgres @l2isbad
- isc_dhcpd @l2isbad
- bind_rndc @l2isbad
- numa
- apps.plugin improvements and freebsd support @vlvkobal
- fail2ban @l2isbad
- freeradius @l2isbad
- nut (monitoring UPSes)
- tc (Linux QoS) now works on qdiscs instead of classes for the same result (a lot faster) @t-h-e
- varnish @l2isbad
New and Improved Alarms
- web_log, many alarms to detect common web site/API issues
- fping, alarms to detect packet loss, disconnects and unusually high latency
-
cpu, cpu utilization alarm now ignores
nice
New and improved alarm notification methods
- HipChat to allow hosted HipChat @frei-style
- discordapp @lowfive
Dashboard Improvements
- dashboard now works on HiDPi screens
- dashboard now shows version of netdata
- dashboard now resets charts properly
- dashboard updated to use latest gauge.js release
Other Improvements
- thanks to @rlefevre netdata now uses a lot of different high resolution system clocks.
netdata has received a lot more improvements from many more contributors! (it was really a lot of work to dig into git log to collect all the above, so forgive me if I forgot to mention a few contributions and contributors).
Thank you all!
Published by ktsaou over 7 years ago
New to netdata? Check its demo: http://my-netdata.io
Release announced on twitter, hacker news, reddit r/linux, reddit r/sysadmin, reddit r/linuxadmin, reddit r/freebsd
Yet another release that makes netdata the fastest netdata ever!
This is probably the release with the largest changeset so far. A lot of work, by a lot of people made this release possible!
FreeBSD, MacOS and FreeNAS
Vladimir Kobal has done a magnificent work porting netdata to FreeBSD and MacOS.
Everything works:
- cpu and interrupts, memory, disks (performance and space monitoring)
- network interfaces and softnet
- IPv4 and IPv6 metrics
- processes and context switches
- IPC (queues, semaphores, shared memory)
- and of course all the netdata external plugins
Wow! Check it live on FreeBSD, at https://freebsd.my-netdata.io/
Backends
netdata supports data archiving to backend databases:
- Graphite
- OpenTSDB
- Prometheus
and of course all the compatible ones (KairosDB, InfluxDB, Blueflood, etc)

With this feature netdata can interface with your existing devops infrastructure and allow you to visualize its metrics with other tools, like grafana.
New Plugins
Ilya Mashchenko has created most of the python data collection plugins in this release! He rocks!
- Systemd Services (real-time monitoring of the resource utilization of all systemd services, using cgroups!)
- FPing (network latency and jitter monitoring with netdata!)
- Postgres databases @facetoe, @moumoul
- Vanish disk cache (v3 and v4) @l2isbad
- ElasticSearch @l2isbad
- HAproxy @l2isbad
- FreeRadius @l2isbad, @lgz
- mdstat (RAID) @l2isbad
- ISC bind (via rndc) @l2isbad
- ISC dhcpd @l2isbad, @lgz
- Fail2Ban @l2isbad
- OpenVPN status log @l2isbad, @lgz
- NUMA memory @tycho
- CPU Idle States @tycho
- gunicorn @deltaskelta
- ECC memory hardware errors
- IPC semaphores
-
uptime ( with a nice badge too:
 )
)
Improved Plugins
- netfilter conntrack
- MySQL/MariaDB (replication) @l2isbad
- ipfs @pjz
- cpufreq @tycho
- hddtemp @l2isbad
- sensors @l2isbad
- nginx @leolovenet
- nginx_log @paulfantom
- phpfpm @leolovenet
- redis @leolovenet
- dovecot @justohall
- cgroups
- disk space
- apps.plugin
- /proc/interrupts @rlefevre
- /proc/softirqs @rlefevre
- /proc/vmstat (system memory charts)
- /proc/net/snmp6 (IPv6 charts)
- /proc/self/meminfo (system memory charts)
- /proc/net/dev (network interfaces)
- tc (linux QoS)
New and Improved Alarms
- MySQL/MariaDB alarms (incl. replication)
- IPFS alarms
- HAproxy alarms
- UDP buffer alarms
- TCP AttemptFails
- ECC memory alarms
- netfilter connections alarms
New Alarm Notification Methods
- messagebird.com @tech-no-logical
- pagerduty.com @jimcooley
- pushbullet.com @tperalta82
- twilio.com @shadycuz
- HipChat
- kafka
Shell Integration
Shell scripts can now query netdata easily!
eval "$(curl -s 'http://localhost:19999/api/v1/allmetrics')"
after this command, all the netdata metrics are exposed to shell. Check:
# source the metrics
eval "$(curl -s 'http://localhost:19999/api/v1/allmetrics')"

# let's see if there are variables exposed by netdata for system.cpu
set | grep "^NETDATA_SYSTEM_CPU"

NETDATA_SYSTEM_CPU_GUEST=0
NETDATA_SYSTEM_CPU_GUEST_NICE=0
NETDATA_SYSTEM_CPU_IDLE=95
NETDATA_SYSTEM_CPU_IOWAIT=0
NETDATA_SYSTEM_CPU_IRQ=0
NETDATA_SYSTEM_CPU_NICE=0
NETDATA_SYSTEM_CPU_SOFTIRQ=0
NETDATA_SYSTEM_CPU_STEAL=0
NETDATA_SYSTEM_CPU_SYSTEM=1
NETDATA_SYSTEM_CPU_USER=4
NETDATA_SYSTEM_CPU_VISIBLETOTAL=5

# let's see the total cpu utilization of the system
echo ${NETDATA_SYSTEM_CPU_VISIBLETOTAL}
5

# what about alarms?
set | grep "^NETDATA_ALARM_SYSTEM_SWAP_"
NETDATA_ALARM_SYSTEM_SWAP_RAM_IN_SWAP_STATUS=CRITICAL
NETDATA_ALARM_SYSTEM_SWAP_RAM_IN_SWAP_VALUE=53
NETDATA_ALARM_SYSTEM_SWAP_USED_SWAP_STATUS=CLEAR
NETDATA_ALARM_SYSTEM_SWAP_USED_SWAP_VALUE=51

# let's get the current status of the alarm 'ram in swap'
echo ${NETDATA_ALARM_SYSTEM_SWAP_RAM_IN_SWAP_STATUS}
CRITICAL

# is it fast?
time curl -s 'http://localhost:19999/api/v1/allmetrics' >/dev/null

real  0m0,070s
user  0m0,000s
sys   0m0,007s

# it is...
# 0.07 seconds for curl to be loaded, connect to netdata and fetch the response back...
The _VISIBLETOTAL variable sums up all the dimensions of each chart.
The format of the variables is:
NETDATA_${chart_id^^}_${dimension_id^^}="${value}"
The value is rounded to the closest integer, since shell script cannot process decimal numbers.
Dashboard Improvements
- dashboard is now faster on firefox, safari, opera, edge (edge is still the slowest)
- dashboard charts legends now have bigger fonts
- SHIFT + mousewheel to zoom charts, works on all browsers
- perfect-scrollbar on the dashboard
- dashboard 4K resolution fixes
- dashboard compatibility fixes for embedding charts in third party web sites
- charts on custom dashboards can have common min/max even if they come from different netdata servers
- alarm log is now saved and loaded back so that the alarm history is available at the dashboard
Other Improvements
- python.d.plugin has received way to many improvements from many contributors!
- charts.d.plugin can now be forked to support multiple independent instances
- registry has been re-factored to lower its memory requirements (required for the public registry)
- simple patterns in cgroups, disks and alarms
- netdata-installer.sh can now correctly install netdata in containers
- supplied logrotate script compatibility fixes
- spec cleanup @breed808
- clocks and timers reworked @rlefevre
netdata has received a lot more improvements from many more contributors! (it was really a lot of work to dig into git log to collect all the above, so forgive me if I forgot to mention a few contributions and contributors).
Thank you all!
Published by ktsaou about 8 years ago
New to netdata? Check its demo: http://my-netdata.io
Release announced on Hacker News
Release announced on reddit r/linux
Release announced on reddit r/sysadmin
Release announced on twitter
At a glance
- the fastest netdata ever (with a better look too)!
- improved IoT and containers support!
- alarms improved in almost every way!
- new plugins:
- softnet netdev,
- extended TCP metrics,
- UDPLite
- NFS v2, v3 client (server was there already),
- NFS v4 server & client,
- APCUPSd,
- RetroShare
- improved plugins:
- mysql,
- cgroups,
- hddtemp,
- sensors,
- phpfm,
- tc (QoS)
In detail
improved alarms!
Many new alarms have been added to detect common kernel configuration errors and old alarms have been re-worked to avoid notification floods.
Alarms now support:
-
notification hysteresis (both static and dynamic)

-
notification self-cancellation, and
-
dynamic thresholds based on current alarm status

Also, a new alarms log:

improved alarm notifications
netdata now supports:
- email notifications
- slack.com notifications on slack channels
- pushover.net notifications (mobile push notifications)
- telegram.org notifications
For all the above methods, netdata supports role-based notifications, with multiple recipients for each role and severity filtering per recipient!
Also, netdata support HTML5 notifications, while the dashboard is open in a browser window (no need to be the active one).

All notifications (HTML5, emails, slack, pushover, telegram) are now clickable to get to the chart that raised the alarm.
other improvements
-
improved IoT support!
netdata builds and runs with musl libc and runs on systems based on busybox.
-
improved containers support!
netdata runs on alpine linux (a low profile linux distribution used in containers).
-
Dozens of other improvements and bugfixes
netdata 1.4.0 - download release tarfiles from http://firehol.org/download/netdata/releases/v1.4.0
Published by ktsaou about 8 years ago
New to netdata? Check its demo: http://my-netdata.io
At a glance
- netdata has health monitoring / alarms!
- netdata generates badges that can be embeded anywhere!
- netdata plugins are now written in python!
- new plugins: redis, memcached, nginx_log, ipfs, apache_cache
IMPORTANT:
Since netdata now uses python plugins, new packages are
required to be installed on a system to allow it work.
For more information, please check the installation page.
In detail
netdata has alarms!
Based on the POLL we made on github, health monitoring was the winner. So here it is!
netdata now has a powerful health monitoring system embedded.

netdata has badges!
netdata can generate badges with live information from the collected metrics.
netdata plugins are now written in python!
Thanks to the great work of Paweł Krupa (@paulfantom), most BASH plugins have been ported to python.
The new python.d.plugin supports both python2 and python3 and data collection from multiple sources for all modules.
The following pre-existing modules have been ported to python:
- apache
- cpufreq
- example
- exim
- hddtemp
- mysql
- nginx
- phpfm
- postfix
- sensors
- squid
- tomcat
The following new modules have been added:
- apache_cache
- dovecot
- ipfs
- memcached
- nginx_log
- redis
other data collectors
Thanks to @simonnagl netdata now reports disk space usage.
other improvements
-
dashboards now transfer certain settings from server to server when changing servers via the my-netdata menu.
The settings transferred are the dashboard theme, the online help status and current pan and zoom timeframe of the dashboard.
-
API improvements:
- reduction functions now support 'min', 'sum' and 'incremental-sum'.
- netdata now offers a multi-threaded and a single threaded web server (single threaded is better for IoT).
-
apps.plugin improvements:
- can now run with command line argument 'without-files' to prevent it from enumating all the open files/sockets/pipes of all running processes.
- apps.plugin now scales the collected values to match the
the total system usage. - apps.plugin can now report guest CPU usage per process.
- repeating errors are now logged once per process.
-
netdata now runs with IDLE process priority (lower than nice 19)
-
netdata now instructs the kernel to kill it first when it starves for memory.
-
netdata listens for signals:
- SIGHUP to netdata instructs it to re-open its log files (new logrotate file added too).
- SIGUSR1 to netdata saves the database
- SIGUSR2 to netdata reloads health / alarms configuration
-
netdata can now bind to multiple IPs and ports.
-
netdata now has new systemd service file (it starts as user netdata and does not fork).
-
Dozens of other improvements and bugfixes
netdata 1.3.0 - download release tarfiles from http://firehol.org/download/netdata/releases/v1.3.0
Published by ktsaou over 8 years ago
Netdata demo sites: http://my-netdata.io
At a glance
- netdata now is 30% faster !
- netdata now has a registry (my-netdata dashboard menu) !
- netdata now monitors Linux Containers (cgroups, docker, lxc, etc) !
IMPORTANT:
This version requires libuuid. The package you need to build netdata is:
- uuid-dev (debian/ubuntu), or
- libuuid-devel (centos/fedora/redhat)
In detail
netdata is now 30% faster !
- Patches submitted by @fredericopissarra improved overall netdata performance by 10%.
- A new improved search function in the internal indexes made all searches faster by 50%, resulting in about 20% better performance for the core of netdata.
- More efficient threads locking in key components contributed to the overall speed up.
netdata now has a central registry !
The central registry tracks all your netdata servers and bookmarks them for you at the my-netdata menu on all dashboards.
Every netdata can act as a registry, but there is also a global registry provided for free for all netdata users!
netdata now monitors Linux Containers !
docker, lxc, or anything else. For each container it monitors CPU, RAM, DISK I/O (network interfaces were already monitored).
Other improvements
- apps.plugin: now uses linux capabilities by default without setuid to root
- netdata has now an improved signal handler thanks to @simonnagl
- API: new improved CORS support
- SNMP: counter64 support fixed
- MYSQL: more charts, about QCache, MyISAM key cache, InnoDB buffer pools, open files
- DISK charts now show mount point when available
- Dashboard: improved support for older web browsers and mobile web browsers (thanks to @simonnagl)
- Multi-server dashboards now allow de-coupled refreshes for each chart, so that if one netdata has a network latency the other charts are not affected
- Dozens of other improvements, optimizations and bug-fixes.
netdata 1.2.0 - download release tarfiles also from http://firehol.org/download/netdata/releases/v1.2.0