Bot releases are visible (Hide)
Published by aschonfeld over 4 years ago
Highlights include:
- #151: allow users to load custom topojson for choropleth maps
Published by aschonfeld over 4 years ago
Highlights Include:
- #200: support for xarray
Published by aschonfeld over 4 years ago
Hotfix release:
- #202: maximum recursion errors when using Pyzo IDE
Published by aschonfeld over 4 years ago
Highlights include:
- #193: Support for JupyterHub Proxy
Published by aschonfeld over 4 years ago
Highlights include:
- #196: dataframes that have datatime indexes without a name
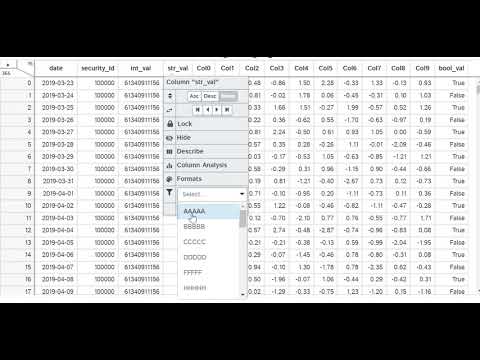
- Added the ability to apply formats to all columns of same dtype
Published by aschonfeld over 4 years ago
Highlights includes:
- #191: improving outlier filter suggestions
- #190: hide "Animate" inputs when "Percentage Sum" or "Percentage Count" aggregations are used
- #189: hide "Barsort" when grouping is being applied
- #187: missing & outlier tooltip descriptions on column headers
- #186: close "Describe" tab after clicking "Update Grid"
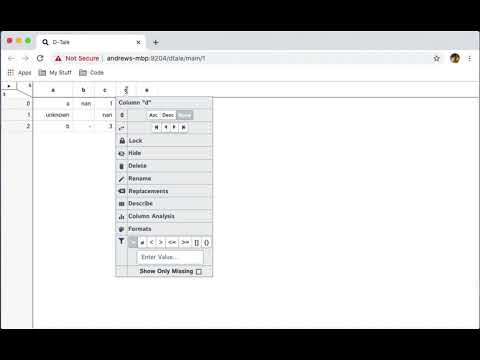
- #122: editable cells
- npm package upgrades
- circleci build script refactoring
Published by aschonfeld over 4 years ago
Highlights Include:
- now available in python 3.7 & 3.8
- #184: "nan" not showing up for numeric columns
- #181: percentage sum/count charts
- #179: confirmation for column deletion
- #176: highlight background of outliers/missing values
- #175: column renaming
- #174: moved "Describe" popup to new browser tab
- #173: wider column input box for GroupBy in "Summarize Data" popup
- #172: allowing groups to be specified in 3D scatter
- #170: filter "Value" dropdown for maps to only int or float columns
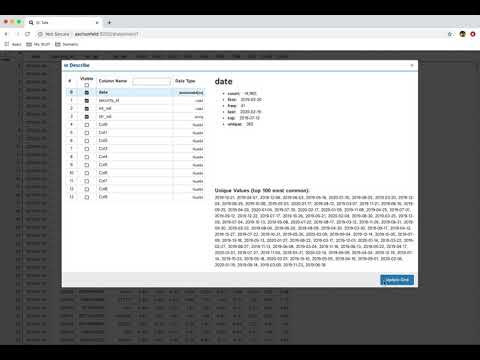
- #164: show information about missing data in "Describe" popup
Published by aschonfeld over 4 years ago
Highlights Include:
- #144, changing data types on columns
Published by aschonfeld over 4 years ago
1.8.7 (2020-4-8)
1.8.6 [hotfix] (2020-4-5)
- updates to setup.py to include images
1.8.5 [hotfix] (2020-4-5)
- fixed bug with column calculation for map inputs
- #149
1.8.4 [hotfix] (2020-4-5)
- update to setup.py to include missing static topojson files
- #145
1.8.3 (2020-4-4)
- #143, scattergeo map chart UI changes
- updated offline chart generation of maps to work without loading topojson from the web
- fix to allow correlations timeseries to handle when date columns jump between rolling & non-rolling
- added slider to animation and added animation to maps
- fixes for IE 11 compatibility issues
- labeling changes for "Reshape" popup
- added grouping to maps
1.8.2 (2020-4-1)
- #129, show dtype when hovering over header in "Highlight Dtypes" mode and description tooltips added to main menu
- made "No Aggregation" the default aggregation in charts
- bugfix for line charts with more than 15000 points
- updated "Value Counts" & "Category Breakdown" to return top on initial load
- #118, added scattergeo & choropleth maps
- #121, added "not equal" toggle to filters
- #132, updated resize button to "Refresh Widths"
- added "Animate" toggle to scatter, line & bar charts
- #131, changes to "Reshape Data" window
- #130, updates to pivot reshaper
- #128, additional hover display of code snippets for column creation
- #112, updated "Group" selection to give users the ability to select group values
Published by aschonfeld over 4 years ago
Highlights include:
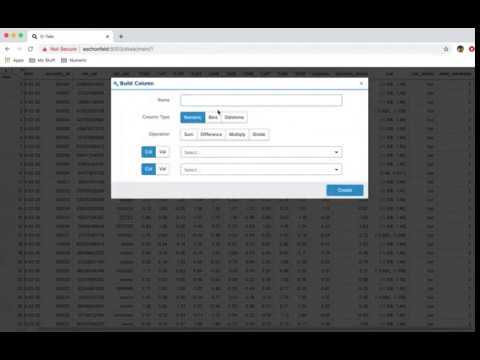
- #92, column builders for random data
- #84, highlight columns based on dtype
- #111, fix for syntax error in charts code export
- #113, updates to "Value Counts" chart in "Column Analysis" for number of values and ordinal entry
- #114, export data to CSV/TSV
- #116, upodated styling for github fork link so "Code Export" is partially clickable
- #119, fixed bug with queries not being passed to functions
- #120, fix to allow duplicate x-axis entries in bar charts
- added "category breakdown" in column analysis popup for float columns
- fixed bug where previous "show missing only" selection was not being recognized
Published by aschonfeld over 4 years ago
Highlights inlcude:
- #102, interactive column filtering for string, date, int, float & bool
- better handling for y-axis management in charts. Now able to toggle between default, single & multi axis
- increased maximum groups to 30 in charts and updated error messaging when it surpasses that for easier filter creation
- bugfix for date string width calculation
- updated sort/filter/hidden header so that you can now click values which will trigger a tooltip for removing individual values
- updated Filter popup to be opened as separate window when needed
Published by aschonfeld over 4 years ago
Published by aschonfeld over 4 years ago
Highlights include:
- Hotfix for "Reshape" popup when forwarding browser to new data instances
Published by aschonfeld over 4 years ago
Highlights include:
- New data storage mechanisms available: Redis, Shelve
- #100, turned off data limits on charts by using WebGL
- #99, graceful handling of issue calculating min/max information for Describe popup
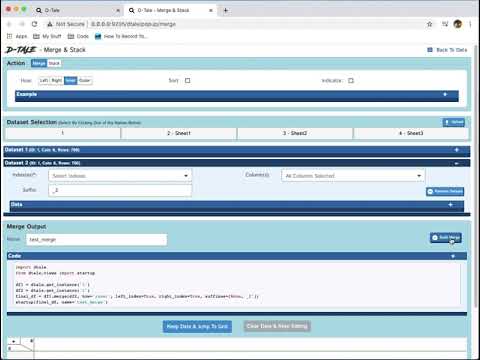
- #91, reshaping of data through usage of aggregations, pivots or transposes
- Export chart to HTML
- Export chart dat to CSV
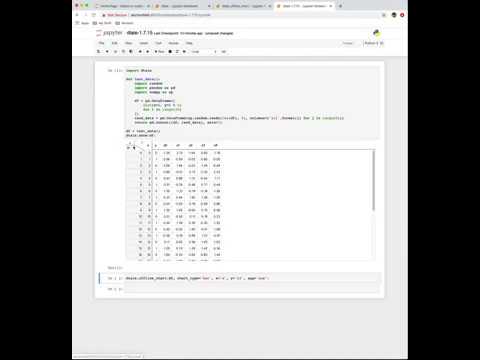
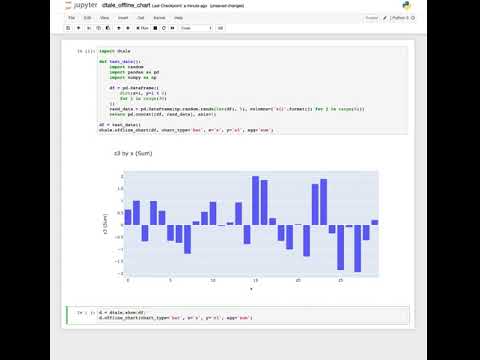
- Offline chart display for use within notebooks
- Removal of data from the Instances popup
- Updated styling of charts to fit full window dimensions
Published by aschonfeld over 4 years ago
Highlights include:
- added syntax highlighting to code exports with react-syntax-highlighting
- added arctic integration test
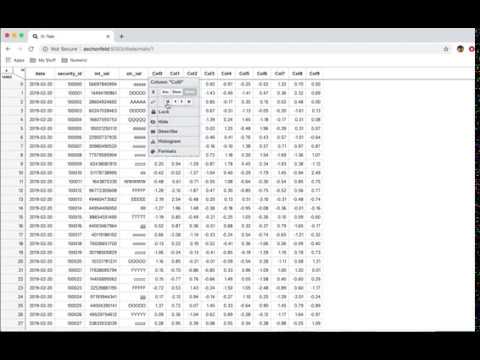
- updated Histogram popup to "Column Analysis" which allows for the following
- Histograms -> integers and floats
- Value Counts -> integers, strings & dates
Published by aschonfeld over 4 years ago
Highlights include:
-
#75, added code snippet functionality to the following:
- main grid, histogram, correlations, column building & charts
- exposed CLI loaders through the following functions dtale.show_csv, dtale.show_json, dtale.show_arctic
- build in such a way that it is easy for custom loaders to be exposed as well
-
#82, pinned
futurepackage to be >= 0.14.0
Published by aschonfeld over 4 years ago
Published by aschonfeld over 4 years ago
Hotfix addressing:
- #77, removal of multiprocessed timeouts
Published by aschonfeld over 4 years ago
Hotfix for:
- centralized global state, #77
- addition of flask_ngrok for use in google colab