
LiveCharts2
Simple, flexible, interactive & powerful charts, maps and gauges for .Net, LiveCharts2 can now practically run everywhere Maui, Uno Platform, Blazor-wasm, WPF, WinForms, Xamarin, Avalonia, WinUI, UWP.
MIT License
Bot releases are hidden (Show)
Published by beto-rodriguez about 1 month ago
- Multiple issues fixed, thanks everyone for reporting ❤️
- Updated targets to net 8.
- NuGet packages are now deterministic
What's Changed
- Net 8 by @beto-rodriguez in https://github.com/beto-rodriguez/LiveCharts2/pull/1363
- Clean build warnings and update with c#12 syntax by @beto-rodriguez in https://github.com/beto-rodriguez/LiveCharts2/pull/1364
- Use ICollection interface instead by @beto-rodriguez in https://github.com/beto-rodriguez/LiveCharts2/pull/1386
- Avalonia dependency property naming fix by @DenysLukianchukAtola in https://github.com/beto-rodriguez/LiveCharts2/pull/1401
- Fix repaints causing ThrowInfiniteSeparators. by @mvphelps in https://github.com/beto-rodriguez/LiveCharts2/pull/1514
- fix: Make Uno.WinUI conditional to Uno targets by @jeromelaban in https://github.com/beto-rodriguez/LiveCharts2/pull/1540
- Update-sdks by @beto-rodriguez in https://github.com/beto-rodriguez/LiveCharts2/pull/1582
- PieChart (and PolarChart) custom legend support (#1489) by @bsilvia in https://github.com/beto-rodriguez/LiveCharts2/pull/1573
- Fix 1422 by @beto-rodriguez in https://github.com/beto-rodriguez/LiveCharts2/pull/1595
- Fix 1420 by @beto-rodriguez in https://github.com/beto-rodriguez/LiveCharts2/pull/1596
- fixes #1415 by @beto-rodriguez in https://github.com/beto-rodriguez/LiveCharts2/pull/1597
- Fixing stuck _isInternalSet flag by @BHandle in https://github.com/beto-rodriguez/LiveCharts2/pull/1394
- refactor accesibility by @beto-rodriguez in https://github.com/beto-rodriguez/LiveCharts2/pull/1600
- rc-3 by @beto-rodriguez in https://github.com/beto-rodriguez/LiveCharts2/pull/1602
- Update targets by @beto-rodriguez in https://github.com/beto-rodriguez/LiveCharts2/pull/1604
New Contributors
- @DenysLukianchukAtola made their first contribution in https://github.com/beto-rodriguez/LiveCharts2/pull/1401
- @mvphelps made their first contribution in https://github.com/beto-rodriguez/LiveCharts2/pull/1514
- @jeromelaban made their first contribution in https://github.com/beto-rodriguez/LiveCharts2/pull/1540
- @bsilvia made their first contribution in https://github.com/beto-rodriguez/LiveCharts2/pull/1573
- @BHandle made their first contribution in https://github.com/beto-rodriguez/LiveCharts2/pull/1394
Full Changelog: https://github.com/beto-rodriguez/LiveCharts2/compare/v2.0.0-rc2...v2.0.0-rc3
The second release candidate of LiveCharts, this is the last preview before the first GA release 🎉.
Performance
Before the first GA release, I decided to spend some time improving the high-performance algorithm, in the next video we are adding 100,000 points each 50ms from multiple threads, then we keep only the last 50 million points in the UI/Memory.
Everything is supper responsive and animated :)
This is a virtualization algorithm, it takes all the the data, and builds a smaller but accurate representation of the full data set, the algorithm evaluates the data at different zoom levels, this takes about 200ms each 10 million records, then it saves some key points in memory (about 13% extra memory allocated), finally when the user interacts with the chart (zooming/panning), the chart can respond in less than 1ms, no matter the total number of records.
This algorithm also works as a circular array, this means that the data can change with basically no performance impact (unless the capacity grows).
These are some benchmarks of the current version:
The high-performance package will be available for everyone with the next release of the library.
Improved interaction on Android/iOS
User interactions with the chart (Zooming, Panning, crosshairs, tapping, scrolling), work much better on both platforms.
New articles
- Explains how to draw directly on the chart using SkiaSharp: https://livecharts.dev/docs/Maui/2.0.0-rc2/samples.general.drawOnCanvas
- Sets pie charts labels in the outsie: https://livecharts.dev/docs/Maui/2.0.0-rc2/samples.pies.outlabels
issues fixed
- #1289
- #935
- #1281
- #1318
- #1329
- #1285
- #1255
- #1334
- #1305
- #1330
- #1291
- #1332
- #1340
Breaking Changes
Sadly, the performance review required to make a small but braking change, if you are using custom mappers, you must update to the new API:
https://livecharts.dev/docs/Maui/2.0.0-rc2/Overview.Mappers
What's Changed
- Bump SkiaSharp from 2.88.5 to 2.88.6 in /src/skiasharp/LiveChartsCore.SkiaSharp by @dependabot in https://github.com/beto-rodriguez/LiveCharts2/pull/1270
- RC1.1 by @beto-rodriguez in https://github.com/beto-rodriguez/LiveCharts2/pull/1276
- rc.1.2 by @beto-rodriguez in https://github.com/beto-rodriguez/LiveCharts2/pull/1278
- Reload MotionCanvas on MAUI by @christiaanderidder in https://github.com/beto-rodriguez/LiveCharts2/pull/1292
- Drop duplicated phrase by @crayxt in https://github.com/beto-rodriguez/LiveCharts2/pull/1310
- Update Uno to 5.x by @beto-rodriguez in https://github.com/beto-rodriguez/LiveCharts2/pull/1339
- Fixes 1329 by @beto-rodriguez in https://github.com/beto-rodriguez/LiveCharts2/pull/1341
- Improves user interaction with the charts by @beto-rodriguez in https://github.com/beto-rodriguez/LiveCharts2/pull/1349
- rc2 by @beto-rodriguez in https://github.com/beto-rodriguez/LiveCharts2/pull/1352
New Contributors
- @christiaanderidder made their first contribution in https://github.com/beto-rodriguez/LiveCharts2/pull/1292
- @crayxt made their first contribution in https://github.com/beto-rodriguez/LiveCharts2/pull/1310
Full Changelog: https://github.com/beto-rodriguez/LiveCharts2/compare/2.0.0-rc1...v2.0.0-rc2
Published by beto-rodriguez about 1 year ago
The first release candidate of LiveCharts2 is finally here, this release fixes a lot of reported issues, and improves the user interaction with the chart on Android, iOS, Mac Catalyst and Windows, a lot of new examples were added to the web site.
Whats next for the LiveCharts2?
Most of the issues of the library seem to be solved now, the first GA release should come soon (November/December 2023), the Backers's Package (performance, themes and extended features) should be available for everyone soon, this package will make it even easier to create stunning charts.
User interaction
This release improves the user interaction with the chart on touch screens, touch pads and the mouse/magic mouse; On MAUI and Uno we use the native events in every OS to create a custom experience for the library, on Avalonia, we use the events provided by the framework.
On previous versions, some examples in the web were not working properly, now every sample works as the docs say.
https://github.com/beto-rodriguez/LiveCharts2/assets/10853349/72c41ac5-96db-4e08-bce3-ae7d797f62d0
https://github.com/beto-rodriguez/LiveCharts2/assets/10853349/79d829c9-5ef2-4691-bd37-2e64a2e3a48e
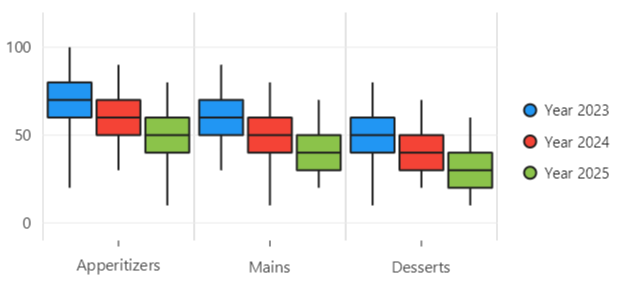
New charts
Since a couple of releases ago, new chart types were added, this release announces the new types:
- Angular gauges
- Error bars
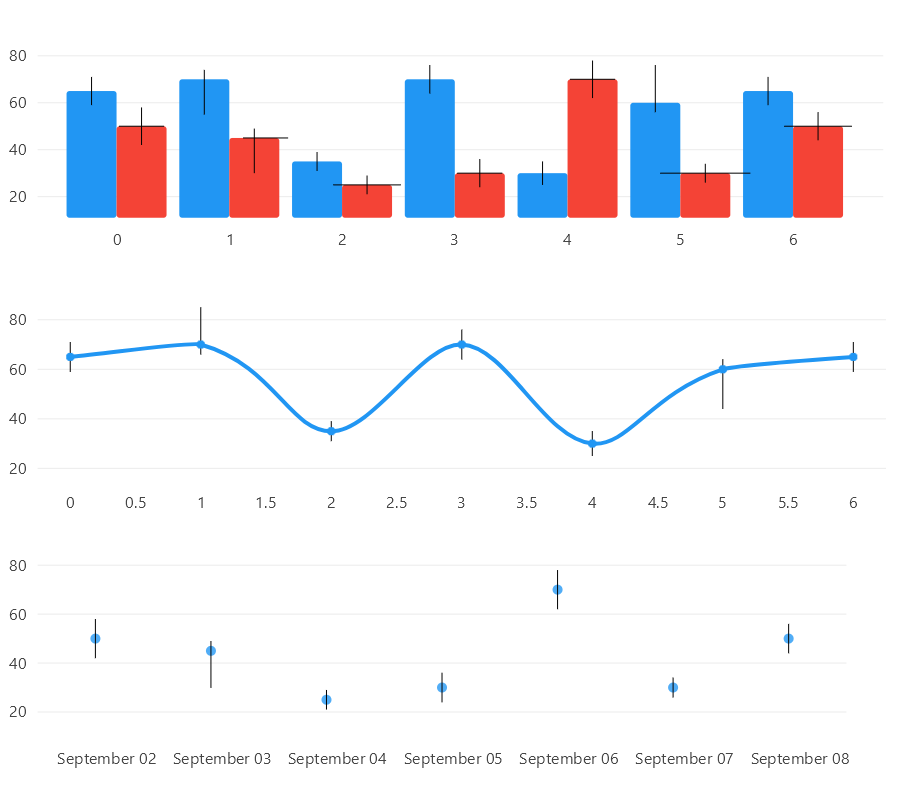
- Box Series
Multiple new examples in the web site
A lot of examples in the repo were not in the web site, there are a lot of new examples:

Issues fixed:
- Multiline labels were improved, in previous versions there were special cases where text was not measured properly.
- Tooltips and legends, now by default wrap every long string into multiple lines, this helps to prevent that the tooltip goes out of the chart, tooltips in LiveCharts are limited to the control area but when you need a "framework specific" tooltip, you can create your own (#912)
- Events on MAUI and Uno work much better, the implementation of native events, allowed LiveCharts to invoke the correct event no matter the OS the chart is running on.
- #1076
- #1188
- #1198
- #1242
- #1209 (updated site sample, see the web site for the solution)
- #1140
- #1200
- #738
- #1145
- #1154
- #1166
- #907
What's Changed
- 2.0.0-beta.911 by @beto-rodriguez in https://github.com/beto-rodriguez/LiveCharts2/pull/1153
- Update gauges by @beto-rodriguez in https://github.com/beto-rodriguez/LiveCharts2/pull/1158
- box series by @beto-rodriguez in https://github.com/beto-rodriguez/LiveCharts2/pull/1172
- Error series by @beto-rodriguez in https://github.com/beto-rodriguez/LiveCharts2/pull/1174
- 2.0.0-beta.920 by @beto-rodriguez in https://github.com/beto-rodriguez/LiveCharts2/pull/1179
- Update docs by @beto-rodriguez in https://github.com/beto-rodriguez/LiveCharts2/pull/1182
- Visual elements pointer down event by @beto-rodriguez in https://github.com/beto-rodriguez/LiveCharts2/pull/1193
- Axes improvements by @beto-rodriguez in https://github.com/beto-rodriguez/LiveCharts2/pull/1196
- Maui events by @beto-rodriguez in https://github.com/beto-rodriguez/LiveCharts2/pull/1201
- Update boxseries.md by @Zottel92 in https://github.com/beto-rodriguez/LiveCharts2/pull/1202
- Fixes to angular gauges by @beto-rodriguez in https://github.com/beto-rodriguez/LiveCharts2/pull/1204
- 2.0.0-beta.950 by @beto-rodriguez in https://github.com/beto-rodriguez/LiveCharts2/pull/1206
- Syncs docs with site. by @beto-rodriguez in https://github.com/beto-rodriguez/LiveCharts2/pull/1207
- Native events by @beto-rodriguez in https://github.com/beto-rodriguez/LiveCharts2/pull/1214
- Gestures standard by @beto-rodriguez in https://github.com/beto-rodriguez/LiveCharts2/pull/1230
- Improve multiline labels by @beto-rodriguez in https://github.com/beto-rodriguez/LiveCharts2/pull/1232
- Labels max width by @beto-rodriguez in https://github.com/beto-rodriguez/LiveCharts2/pull/1238
- RC1 by @beto-rodriguez in https://github.com/beto-rodriguez/LiveCharts2/pull/1245
New Contributors
- @Zottel92 made their first contribution in https://github.com/beto-rodriguez/LiveCharts2/pull/1202
Full Changelog: https://github.com/beto-rodriguez/LiveCharts2/compare/2.0.0-beta.910...2.0.0-rc1
Published by beto-rodriguez about 1 year ago
Fixes a critical memory leak.
What's Changed
- Update axes.md by @beto-rodriguez in https://github.com/beto-rodriguez/LiveCharts2/pull/1144
- Memory review by @beto-rodriguez in https://github.com/beto-rodriguez/LiveCharts2/pull/1151
- 2.0.0-beta.910 by @beto-rodriguez in https://github.com/beto-rodriguez/LiveCharts2/pull/1152
Full Changelog: https://github.com/beto-rodriguez/LiveCharts2/compare/2.0.0-beta.900...2.0.0-beta.910
Published by beto-rodriguez about 1 year ago
MacOS improvements
- Multiple improvements in the labels measuring and positioning, labels were not measured and placed properly specially on MacOS.
Multiple improvements to MAUI
- The MAUI view now considers the
DeviceDisplay.MainDisplayInfo.Densityto scale the plot, now the look of the charts is consistent on multiple devices/OS, if you built a custom scale, now it is no longer necessary. - MAUI zooming and panning was improved, but on desktop devices we still cannot use the mouse wheel to zoom in/out, because MAUI does not provide a way (or an easy one) to detect the mouse wheel moves, if you are interested in this feature, let the MAUI team know it at #16130.
- Now LiveCharts events work properly on MAUI.
Default tooltips are smarter
Now (by default) when a series has no name set, the tooltip will ignore the series label (in older versions the label Series #1, Series #2 ... Series #n was displayed).
But as soon as you set the Series.Name property it will be shown in the tooltip:
When an axis has Labels, the label will be used as the header of the tooltip:
Transforms animations were improved
There was a bug in the core of LiveCharts that caused that transforms were not animated properly; they are now fixed:
Right to left writing
- Now you can configure LiveCharts to render tooltips and labels from right to left.

LiveCharts.Configure(config => config
  .HasGlobalSKTypeface(SKTypeface.FromFamilyName("Noto Naskh Arabic"))
  .UseRightToLeftSettings());
It is now easy to create SVG based points:
    var seriesCollection = new ISeries[]
    {
        new LineSeries<double, SVGPathGeometry>
        {
            Values = new double[] { -2, 2, 1, 3, -1, 4, 3 },
            Fill = null,
            GeometrySvg = SVGPoints.Star,
            GeometrySize = 20
        },
        new LineSeries<double, SVGPathGeometry>
        {
            Values = new double[] { 3, 4, -1, 3, 1, 2, -2 },
            Fill = null,
            GeometrySvg = SVGPoints.Heart,
            GeometrySize = 20
        },
        new LineSeries<double, SVGPathGeometry>
        {
            Values = new double[] { -2, 2, 1, 3, -1, 4, 3 },
            Fill = null,
            GeometrySvg = "insert your svg path here",
            GeometrySize = 20
        },
    };
Scrollable charts
MVVM improved
There are new commands that are useful to follow MVVM, the scrollable chart sample above implements the MVVM pattern, also the add point on click sample was updated to use MVVM.
Fixed issues
-#119
-#410
-#481
-#834
-#906
-#945
-#1063
-#1081
-#1087
-#1096
-#1099
-#1109
-#1112
-#1113
-#1120
-#1123
-#1124
-#1132
-#1135
-#1139
-#1140
Other changes (auto-generated)
- Upgrade to Avalonia 11.0.0-preview5 by @jp2masa in https://github.com/beto-rodriguez/LiveCharts2/pull/924
- Upgrade to Avalonia 11.0.0-preview7 by @jp2masa in https://github.com/beto-rodriguez/LiveCharts2/pull/978
- Upgrade to Avalonia 11.0.0-preview8 by @jp2masa in https://github.com/beto-rodriguez/LiveCharts2/pull/1011
- Upgrade to Avalonia 11.0.0-rc1.1 by @jp2masa in https://github.com/beto-rodriguez/LiveCharts2/pull/1037
- Update 1.5.mappers.md by @beto-rodriguez in https://github.com/beto-rodriguez/LiveCharts2/pull/1058
- Bump Microsoft.Windows.Compatibility from 7.0.0 to 7.0.3 in /samples/UnoPlatformSample/UnoPlatformSample.Wasm by @dependabot in https://github.com/beto-rodriguez/LiveCharts2/pull/1065
- beta-801 by @beto-rodriguez in https://github.com/beto-rodriguez/LiveCharts2/pull/1070
- beta.802 by @beto-rodriguez in https://github.com/beto-rodriguez/LiveCharts2/pull/1088
- Docs typo by @beto-rodriguez in https://github.com/beto-rodriguez/LiveCharts2/pull/1092
- Scrollable charts by @beto-rodriguez in https://github.com/beto-rodriguez/LiveCharts2/pull/1102
- Avalonia preview by @beto-rodriguez in https://github.com/beto-rodriguez/LiveCharts2/pull/814
- 2.0.0-beta.810 by @beto-rodriguez in https://github.com/beto-rodriguez/LiveCharts2/pull/1103
- patch build errors in UnoPlatformSample by @dmedine in https://github.com/beto-rodriguez/LiveCharts2/pull/1107
- Update 1.2.install.md by @beto-rodriguez in https://github.com/beto-rodriguez/LiveCharts2/pull/1110
- Improve events and commands by @beto-rodriguez in https://github.com/beto-rodriguez/LiveCharts2/pull/1111
- Improve events and commands by @beto-rodriguez in https://github.com/beto-rodriguez/LiveCharts2/pull/1114
- 2.0.0-beta.850 by @beto-rodriguez in https://github.com/beto-rodriguez/LiveCharts2/pull/1116
- Missing things for release build by @beto-rodriguez in https://github.com/beto-rodriguez/LiveCharts2/pull/1117
- 2.0.0-beta.850.1 by @beto-rodriguez in https://github.com/beto-rodriguez/LiveCharts2/pull/1119
- beta.855 by @beto-rodriguez in https://github.com/beto-rodriguez/LiveCharts2/pull/1125
- Fix labels by @beto-rodriguez in https://github.com/beto-rodriguez/LiveCharts2/pull/1130
- 2.0.0-beta.860 by @beto-rodriguez in https://github.com/beto-rodriguez/LiveCharts2/pull/1131
- Svg based gemetries by @beto-rodriguez in https://github.com/beto-rodriguez/LiveCharts2/pull/1134
- Improves rtl rendering by @beto-rodriguez in https://github.com/beto-rodriguez/LiveCharts2/pull/1137
- Adds more tests to pie labels by @beto-rodriguez in https://github.com/beto-rodriguez/LiveCharts2/pull/1141
- 2.0.0-beta.900 by @beto-rodriguez in https://github.com/beto-rodriguez/LiveCharts2/pull/1143
New Contributors
- @jp2masa made their first contribution in https://github.com/beto-rodriguez/LiveCharts2/pull/924
Full Changelog: https://github.com/beto-rodriguez/LiveCharts2/compare/v2.0.0-beta.800...2.0.0-beta.900
Published by beto-rodriguez over 1 year ago
This release fixes a bunch of bugs and visual glitches (thanks for all the reports!) and also reinforces the layout system of the library, useful to create custom legends or tooltips (and more, no docs about it yet), Now the library has its own version of Stack/wrap panels and also tables, a lot of new tests were introduced and helped to clean and find a lot of issues in the library.
Should I update?
Yes! this should be a mature version of the library; there a bunch of new tests introduced in this version, a lot of fixed issues, it is recommended to update if you are using an older version, there are only a couple of braking changes, and they should only affect you if you built a custom legend or tooltip.
Most of the known issues of the library should be solved now, there is a low change to introduce a new braking change after this release in the way to version 2.0.0.
What is the state of the library now?
In general, the core features of the library seem really solid (there are a few issues like #834 that need to be fixed yet), soon the next step will be to spend more time on the supported platform specific bugs, please keep reporting it helps a lot.
Better tooltips
Tooltips changed a lot in the last couple of releases, now the library completely draws them instead of using the Framework to render them, this introduced some new bugs and that is why the layout system of the library was reinforced, ToolTips look better and are placed in a smarter way:
Now it is easier to customize tooltips, in general VisualElements in the library had a deep review, in the next case, there is a bounce animation for the tooltip, this demonstrates the flexibility of LiveCharts to build animations and drawn controls:
Better legends
Same as tooltips, now legends behave much better, and by default wrap the content when there is not enough space:
Customs legends are more flexible:
Fixed issues
#410
#519
#731
#747
#764
#793
#795
#832
#845
#849
#859
#861
#869
#928
#934
#937
#953
#964
#970
#987
#990
#1046
Breaking changes
1. Custom legends
IChartLegend changed, this should only affect you if you built a custom legend.
Previously
public interface IChartLegend<TDrawingContext>
{
    void Draw(Chart<TDrawingContext> chart);
}
Now
public interface IChartLegend<TDrawingContext>
{
    void Draw(Chart<TDrawingContext> chart);

    LvcSize Measure(Chart<TDrawingContext> chart);
}
2. Custom tooltips
This should only affect you if you built a custom tooltip, this change prevents a tooltip to hold a refence to the chart, instead LiveCharts will inject the chart.
IChartTooltip<SkiaSharpDrawingContext>.Hide() method changed to IChartTooltip<SkiaSharpDrawingContext>.Hide(Chart<TDrawingContext> chart)
This is an example of how to migrate a custom tooltip from version beta.710 and lower:
Previously
public class SKDefaultTooltip : IChartTooltip<SkiaSharpDrawingContext>
{
    private Chart<SkiaSharpDrawingContext> _chart;

   // then we used to set the _chart in the Show() method.

    public void Hide()
    {
        if (_chart is null || _panel is null) return;
        _chart.RemoveVisual(_panel);
    }
}
Now
public class SKDefaultTooltip : IChartTooltip<SkiaSharpDrawingContext>
{
    public void Hide(Chart<SkiaSharpDrawingContext> chart)
    {
        if (chart is null || _panel is null) return;
        chart.RemoveVisual(_panel);
    }
}
3. Some event handlers were simplified.
For the series: LineSeries, StepLineSeries, StackedAreaSeries and StackedStepAreaSeries the ChartPointPointerDown, ChartPointPointerHover and ChartPointPointerHoverLost events are now much simpler, if you are using any of those events in any of those series, you must update the handler method. This makes all the series events consistent.
This is an example of how to migrate from beta.710 and lower:
Previously
var lineSeries = new LineSeries<int>();

lineSeries.ChartPointPointerDown +=
   (IChartView chart, ChartPoint<int, BezierPoint<CircleGeometry>, LabelGeometry>? point) =>
    {
        // point was clicked!
    };
Now
var lineSeries = new LineSeries<int>();

lineSeries.ChartPointPointerDown +=
    (IChartView chart, ChartPoint<int, CircleGeometry, LabelGeometry>? point) =>
    {
        // point was clicked!
    };
What's Changed
- Null label text can ruin whole app by @pkindruk in https://github.com/beto-rodriguez/LiveCharts2/pull/831
- Better unit tests by @beto-rodriguez in https://github.com/beto-rodriguez/LiveCharts2/pull/841
- New tests and call pack script instead by @beto-rodriguez in https://github.com/beto-rodriguez/LiveCharts2/pull/842
- New tests to CI by @beto-rodriguez in https://github.com/beto-rodriguez/LiveCharts2/pull/843
- New tests to CI by @beto-rodriguez in https://github.com/beto-rodriguez/LiveCharts2/pull/844
- Non latin chars by @beto-rodriguez in https://github.com/beto-rodriguez/LiveCharts2/pull/848
- Improves multiline labels measure by @beto-rodriguez in https://github.com/beto-rodriguez/LiveCharts2/pull/866
- beta 701 by @beto-rodriguez in https://github.com/beto-rodriguez/LiveCharts2/pull/902
- Expose MiniatureShapeSize on ISeries interface by @MithrilMan in https://github.com/beto-rodriguez/LiveCharts2/pull/880
- update mvvm nuget package to 8.1.0 by @heartacker in https://github.com/beto-rodriguez/LiveCharts2/pull/891
- Max limit and Low Limit typo by @ilang-redler in https://github.com/beto-rodriguez/LiveCharts2/pull/897
- Fix Add registrar:static option for Mobile Sample by @ChrisPulman in https://github.com/beto-rodriguez/LiveCharts2/pull/923
- Update Samples to CommunityToolkit.Mvvm 8.1.0. Fix Breaking Changes by @Kugelhaufen in https://github.com/beto-rodriguez/LiveCharts2/pull/986
- Update uno by @beto-rodriguez in https://github.com/beto-rodriguez/LiveCharts2/pull/994
- Update master by @beto-rodriguez in https://github.com/beto-rodriguez/LiveCharts2/pull/997
- Dev by @beto-rodriguez in https://github.com/beto-rodriguez/LiveCharts2/pull/1003
- Update Generic.xaml by @ali50m in https://github.com/beto-rodriguez/LiveCharts2/pull/1005
- Update legends.md by @ignacioinnovo in https://github.com/beto-rodriguez/LiveCharts2/pull/1012
- #859 Do not override tooltip in InitializeCore method by @maagy in https://github.com/beto-rodriguez/LiveCharts2/pull/985
- Better own visuals by @beto-rodriguez in https://github.com/beto-rodriguez/LiveCharts2/pull/1021
- Improve tooltips by @beto-rodriguez in https://github.com/beto-rodriguez/LiveCharts2/pull/1028
- Fixes 731 by @beto-rodriguez in https://github.com/beto-rodriguez/LiveCharts2/pull/1041
- Mappers docs by @beto-rodriguez in https://github.com/beto-rodriguez/LiveCharts2/pull/1052
- Data labels by @beto-rodriguez in https://github.com/beto-rodriguez/LiveCharts2/pull/1055
- beta.800 by @beto-rodriguez in https://github.com/beto-rodriguez/LiveCharts2/pull/1056
New Contributors
- @MithrilMan made their first contribution in https://github.com/beto-rodriguez/LiveCharts2/pull/880
- @heartacker made their first contribution in https://github.com/beto-rodriguez/LiveCharts2/pull/891
- @ilang-redler made their first contribution in https://github.com/beto-rodriguez/LiveCharts2/pull/897
- @Kugelhaufen made their first contribution in https://github.com/beto-rodriguez/LiveCharts2/pull/986
- @ali50m made their first contribution in https://github.com/beto-rodriguez/LiveCharts2/pull/1005
- @ignacioinnovo made their first contribution in https://github.com/beto-rodriguez/LiveCharts2/pull/1012
- @maagy made their first contribution in https://github.com/beto-rodriguez/LiveCharts2/pull/985
Full Changelog: https://github.com/beto-rodriguez/LiveCharts2/compare/v2.0.0-beta.700...v2.0.0-beta.800
Published by beto-rodriguez almost 2 years ago
Beta.700
Multiple improvements in the Blazor WebAssembly view, take a look at this web site, it is running LiveCharts on the browser with an amazing performance. Improvements also in memory management by @pkindruk, now the library consumes less resources. Themes are ready for production and will soon be available for everyone. Tooltips had a full review; tooltips are now completely drawn by the library instead of the UI framework.
LiveCharts on the browser
Take a look at LiveCharts running in the broswer
Multiple improvements in net 7 allow LiveCharts to run in the browser, with an amazing performance via Blazor WASM, you can find that site in this repository, it is Blazor Sample project, the loading time of the site is amazing for a SPA, Blazor is just amazing.
Memory management
The library is more efficient to render the charts, this is an effort of @pkindruk that made significant improvements on memory allocation.
Themes
Themes had a deep review, there are basically no changes on the default themes, but internally there is a new world behind them, themes docs will be public soon, it is now super easy to create themes for the library.
Tooltips and legends
Tooltips and legends are now completely handled by the library, due multiple issues we faced with the old approach (use the UI framework to render them), Tooltips are now animated, have rounded borders, shadows and should consume less resources, in older versions all those previous factors depend on the UI Framework.
Breaking changes
Tooltips and legends fonts and text size are now handled by the library, this means that we must use the LiveCharts API to give format to text in tooltips and legends:
cartesianChart = new CartesianChart
{
    Series = viewModel.Series,

    TooltipTextSize = 16,
    TooltipTextPaint = new SolidColorPaint
    {
        Color = new SKColor(242, 244, 195),
        SKTypeface = SKTypeface.FromFamilyName("Courier New")
    },
    TooltipBackgroundPaint =new SolidColorPaint(new SKColor(72, 0, 50))
};
The site is updated you can there find a sample for your target UI framework.
This has multiple benefits, we have full control over what is going on all the platforms, instead of depending on 9 different APIS (all the platforms) also tooltips and legends are now team-able.
What's Changed
- Draw on canvas by @beto-rodriguez in https://github.com/beto-rodriguez/LiveCharts2/pull/665
- b.501 by @beto-rodriguez in https://github.com/beto-rodriguez/LiveCharts2/pull/666
- beta.502 by @beto-rodriguez in https://github.com/beto-rodriguez/LiveCharts2/pull/694
- beta.510 by @beto-rodriguez in https://github.com/beto-rodriguez/LiveCharts2/pull/695
- b.511 by @beto-rodriguez in https://github.com/beto-rodriguez/LiveCharts2/pull/696
- update dev by @beto-rodriguez in https://github.com/beto-rodriguez/LiveCharts2/pull/697
- b.512 by @beto-rodriguez in https://github.com/beto-rodriguez/LiveCharts2/pull/698
- beta.513 by @beto-rodriguez in https://github.com/beto-rodriguez/LiveCharts2/pull/700
- Crosshair snapping by @EniacMlezi in https://github.com/beto-rodriguez/LiveCharts2/pull/701
- beta.515 by @beto-rodriguez in https://github.com/beto-rodriguez/LiveCharts2/pull/729
- fixed sample by @beto-rodriguez in https://github.com/beto-rodriguez/LiveCharts2/pull/730
- Always add Crosshair Line and Label geo to PaintTask by @EniacMlezi in https://github.com/beto-rodriguez/LiveCharts2/pull/746
- Better visuals/controls by @beto-rodriguez in https://github.com/beto-rodriguez/LiveCharts2/pull/768
- Fixes issue #411. by @Kevin-Seiden in https://github.com/beto-rodriguez/LiveCharts2/pull/766
- beta.600 by @beto-rodriguez in https://github.com/beto-rodriguez/LiveCharts2/pull/776
- beta.602 by @beto-rodriguez in https://github.com/beto-rodriguez/LiveCharts2/pull/782
- Fix default update throttling value. Add to chart settings. by @pkindruk in https://github.com/beto-rodriguez/LiveCharts2/pull/787
- beta.603 by @beto-rodriguez in https://github.com/beto-rodriguez/LiveCharts2/pull/788
- update version by @beto-rodriguez in https://github.com/beto-rodriguez/LiveCharts2/pull/789
- Reduce gc allocations on render loop by @pkindruk in https://github.com/beto-rodriguez/LiveCharts2/pull/792
- Styles and themes by @beto-rodriguez in https://github.com/beto-rodriguez/LiveCharts2/pull/799
- Bump Newtonsoft.Json from 13.0.1 to 13.0.2 in /src/LiveChartsCore by @dependabot in https://github.com/beto-rodriguez/LiveCharts2/pull/809
- Prevent setting MotionCanvas.Sync to null. by @pkindruk in https://github.com/beto-rodriguez/LiveCharts2/pull/811
- Cleaning old/obsolete themes logic by @beto-rodriguez in https://github.com/beto-rodriguez/LiveCharts2/pull/812
- Fix some legend rendering issues. by @pkindruk in https://github.com/beto-rodriguez/LiveCharts2/pull/821
- beta 700 by @beto-rodriguez in https://github.com/beto-rodriguez/LiveCharts2/pull/829
New Contributors
- @EniacMlezi made their first contribution in https://github.com/beto-rodriguez/LiveCharts2/pull/701
- @Kevin-Seiden made their first contribution in https://github.com/beto-rodriguez/LiveCharts2/pull/766
- @pkindruk made their first contribution in https://github.com/beto-rodriguez/LiveCharts2/pull/787
- @dependabot made their first contribution in https://github.com/beto-rodriguez/LiveCharts2/pull/809
There are multiple issues fixed, please take a look at the full log for more details
Full Changelog: https://github.com/beto-rodriguez/LiveCharts2/compare/beta.500...v2.0.0-beta.700
Published by beto-rodriguez about 2 years ago
What's new?
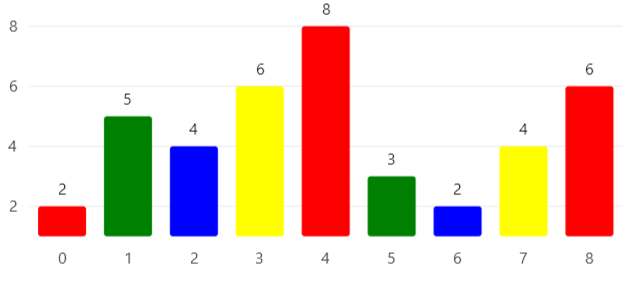
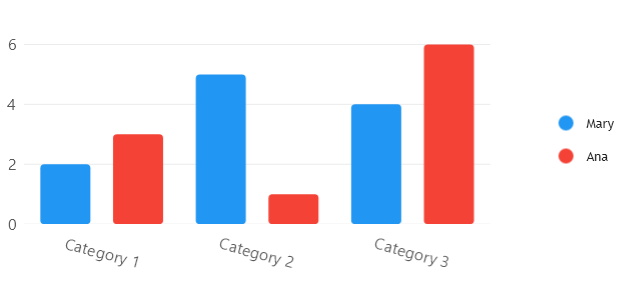
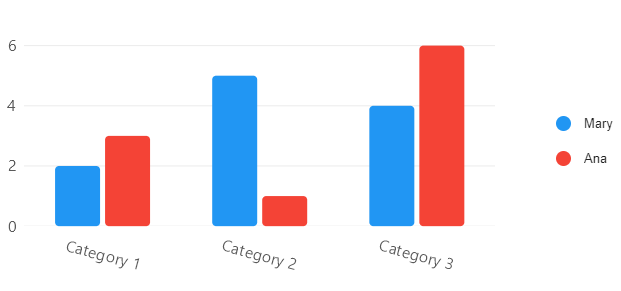
Conditional draw is back!
Conditional draw is back to v2! this was the last thing missing from v0 🚀, the library needed to mature to implement this, now it feels solid enough to add this feature.
In the following sample, we highlight the bars above 5.

// full code at
// https://github.com/beto-rodriguez/LiveCharts2/blob/master/samples/ViewModelsSamples/General/ConditionalDraw/ViewModel.cs
var series1 = new ColumnSeries<ObservableValue>
{
    Name = "Mary",
    Values = new ObservableValue[] { ... }
}
.WithConditionalPaint(new SolidColorPaint(SKColors.Black.WithAlpha(50)))
.When(point => point.Model?.Value > 5);
Clockwise pies and gaunges
You can change the direction of a pie or a gauge using the PieChart.IsClockwise property, this sample has a cool bounce animation 😎

Crosshair just works!

// full code at:
// https://github.com/beto-rodriguez/LiveCharts2/blob/dev/samples/ViewModelsSamples/Axes/Style/ViewModel.cs

private static readonly SKColor s_crosshair = new(255, 171, 145);

public Axis[] XAxes { get; set; } =
{
    new Axis
    {
        CrosshairPaint = new SolidColorPaint
        {
            Color = s_crosshair,
            StrokeThickness = 3
        },
        CrosshairLabelsPaint = new SolidColorPaint
        {
            Color = SKColors.Black,
            SKFontStyle =  new SKFontStyle(SKFontStyleWeight.SemiBold, SKFontStyleWidth.Normal, SKFontStyleSlant.Upright),
        },
        CrosshairLabelsBackground = s_crosshair.AsLvcColor(),
        CrosshairPadding = new Padding(10, 20, 10, 10)
    }
};
Fonts are flexible now
Now we can style fonts, bold, italics, fonts and more.

// full code at:
// https://github.com/beto-rodriguez/LiveCharts2/blob/dev/samples/ViewModelsSamples/Axes/LabelsFormat/ViewModel.cs
public Axis[] XAxes { get; set; } =
{
    new Axis
    {
        Name = "Salesman/woman",
        Labels = new string[] { "王", "赵", "张" },
        LabelsPaint = new SolidColorPaint
        {
            Color = SKColors.Black,
            //  now the library exposes the SKTypeface on paint objects.
            SKTypeface = SKFontManager.Default.MatchCharacter('汉')
        }
    }
};

public Axis[] YAxes { get; set; } =
{
    new Axis
    {
        Name = "Sales amount",
        NamePadding = new LiveChartsCore.Drawing.Padding(0, 15),
        Labeler = Labelers.Currency,
        LabelsPaint = new SolidColorPaint
        {
            Color = SKColors.Blue,
            FontFamily = "Times New Roman",
            SKFontStyle = new SKFontStyle(SKFontStyleWeight.ExtraBold, SKFontStyleWidth.Normal, SKFontStyleSlant.Italic)
        },
    }
};
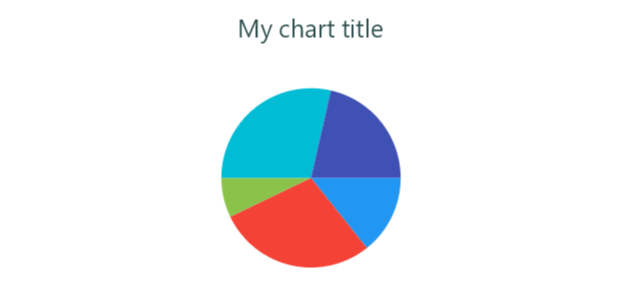
We can now set titles to charts.
In this sample we place a LabelVisual, but you can place any visual actually, this is specially useful to generate images with the library where you do not have a UI to set a title.

// full code:
// view:              https://github.com/beto-rodriguez/LiveCharts2/blob/master/samples/WPFSample/Lines/Basic/View.xaml
// viewmodel:    https://github.com/beto-rodriguez/LiveCharts2/blob/master/samples/ViewModelsSamples/Lines/Basic/ViewModel.cs

public LabelVisual Title { get; set; } =
    new LabelVisual
    {
        Text = "My chart title",
        TextSize = 25,
        Padding = new LiveChartsCore.Drawing.Padding(15),
        Paint = new SolidColorPaint(SKColors.DarkSlateGray)
    };
There is now an easy way to control the max zoom level of a chart.
see #630 for more info.
Fixed issues
- #639
- #638
- #413
- #637
- #601 (unconfirmed)
- #607
- #618
- #620
- #623
- #629
- #634
- #642
Full Changelog: https://github.com/beto-rodriguez/LiveCharts2/compare/v2.0.0-beta.400...beta.500
Published by beto-rodriguez about 2 years ago
New Features:
New visuals to Axes
Now Axes are much more flexible, there are multiple new properties (SubseparatorsPaint, TicksPaint, SubticksPaint and ZeroPaint):

// this is just a sample there is missing code, full sample at:
// https://github.com/beto-rodriguez/LiveCharts2/blob/master/samples/ViewModelsSamples/Axes/Style/ViewModel.cs

private static readonly SKColor s_gray = new(195, 195, 195);
private static readonly SKColor s_gray1 = new(160, 160, 160);
private static readonly SKColor s_gray2 = new(90, 90, 90);
private static readonly SKColor s_dark3 = new(60, 60, 60);

new Axis
{
    LabelsPaint = new SolidColorPaint(s_gray),
    SeparatorsPaint = new SolidColorPaint
    {
        Color = s_gray,
        StrokeThickness = 1,
        PathEffect = new DashEffect(new float[] { 3, 3 })
    },
    SubseparatorsPaint = new SolidColorPaint
    {
        Color = s_gray2,
        StrokeThickness = 0.5f
    },
    ZeroPaint = new SolidColorPaint
    {
        Color = s_gray1,
        StrokeThickness = 2
    },
    TicksPaint = new SolidColorPaint
    {
        Color = s_gray,
        StrokeThickness = 1.5f
    },
    SubticksPaint = new SolidColorPaint
    {
        Color = s_gray,
        StrokeThickness = 1
    }
}
This is also useful to build cleaner multi-axes charts:

// full code at:
// https://github.com/beto-rodriguez/LiveCharts2/blob/master/samples/ViewModelsSamples/Axes/Multiple/ViewModel.cs
Visual elements are back to v2
With this feature we can draw any shape to the chart and scale them using the chart scale (pixels is also supported), it is also useful to add comments or notes to a chart, the API is simple, there is going to be a better sample in the site, but at this point you can browse the source code of this sample (link below).

// full code at:
// https://github.com/beto-rodriguez/LiveCharts2/blob/master/samples/ViewModelsSamples/General/VisualElements/ViewModel.cs

public IEnumerable<ChartElement<SkiaSharpDrawingContext>> VisualElements { get; set; } = new List<ChartElement<SkiaSharpDrawingContext>>
{
     new GeometryVisual<RectangleGeometry>
     {
         X = 2.5,
         Y = 3.5,
         LocationUnit = MeasureUnit.ChartValues,
         Width = 4,
         Height = 2,
         SizeUnit = MeasureUnit.ChartValues,
         Fill = new SolidColorPaint(new SKColor(239, 83, 80, 50)) { ZIndex = 10 },
         Stroke = new SolidColorPaint(new SKColor(239, 83, 80)) { ZIndex = 10, StrokeThickness = 1.5f },
     },
     new GeometryVisual<OvalGeometry>
     {
         X = 5.5,
         Y = 6,
         LocationUnit = MeasureUnit.ChartValues,
         Width = 4,
         Height = 5,
         SizeUnit = MeasureUnit.ChartValues,
         Fill = new SolidColorPaint(new SKColor(100, 221, 23, 50)) { ZIndex = - 10 },
         Stroke = new SolidColorPaint(new SKColor(100, 221, 23)) { ZIndex = -10, StrokeThickness = 1.5f },
     },
    // MyGeometry is an SVG icon from google material symbols font:
    // https://github.com/beto-rodriguez/LiveCharts2/blob/master/samples/ViewModelsSamples/General/VisualElements/MyGeometry.cs
     new GeometryVisual<MyGeometry>
     {
         X = 18,
         Y = 6,
         LocationUnit = MeasureUnit.ChartValues,
         Width = 100,
         Height = 100,
         SizeUnit = MeasureUnit.Pixels,
         Fill = new SolidColorPaint(new SKColor(251, 192, 45, 50)) { ZIndex = 10 },
         Stroke = new SolidColorPaint(new SKColor(251, 192, 45)) { ZIndex = 10, StrokeThickness = 1.5f },
     },
     new LabelVisual
     {
         Text = "What happened here?",
         X = 11,
         Y = 1,
         TextSize = 16,
         Paint = new SolidColorPaint(new SKColor(250, 250, 250)) { ZIndex = 11 },
         BackgroundColor = new LvcColor(55, 71, 79),
         Padding = new Padding(12),
         LocationUnit = MeasureUnit.ChartValues,
         Translate = new LvcPoint(0, -35)
     }
};
The library now supports multi-line labels https://github.com/beto-rodriguez/LiveCharts2/issues/424
We can finally generate image charts with legends https://github.com/beto-rodriguez/LiveCharts2/issues/144
Fixed issues:
- #536
- #471
- #424
- #413
- #389
- #365
- #199
- #144
- #556
- #584
Full Changelog: https://github.com/beto-rodriguez/LiveCharts2/compare/2.0.0-beta.361...v2.0.0-beta.400
Published by beto-rodriguez about 2 years ago
New Features
Zoom by section
We can now use the mouse right button to use the "zoom by section" feature, it works for all the zooming modes in the library.

Highlights
-
To keep working in the high performance package, The
DataFactoryclass had a deep review, everything must be cleaner and should improve in general the performance of the library. -
Now the library handles better
Null/Gaps, we can now usenullas a point input and the library will handle that:, this only used to work for nullable primitive types (int?,double?,float?... etc), now we can usenullfor any object.
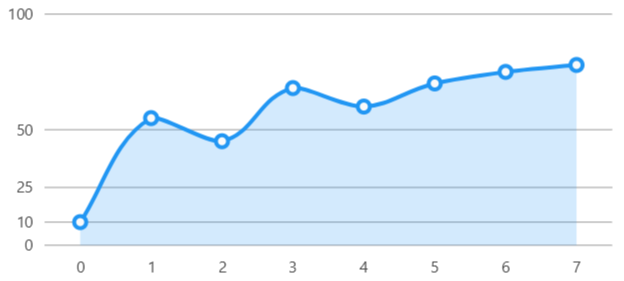
Older versions
new LineSeries<ObservablePoint>
{
    Values = new ObservablePoint[]
    {
        new ObservablePoint { X = 0, Y = 1 },
        new ObservablePoint { X = 1, Y = 4 },
        new ObservablePoint { X = 3, Y = null },
        new ObservablePoint { X = 4, Y = 5 },
        new ObservablePoint { X = 6, Y = 1 },
        new ObservablePoint { X = 8, Y = 6 },
    }
}
Now: (old syntax is also supported)
new LineSeries<ObservablePoint>
{
    Values = new ObservablePoint[]
    {
        new ObservablePoint { X = 0, Y = 1 },
        new ObservablePoint { X = 1, Y = 4 },
        null,
        new ObservablePoint { X = 4, Y = 5 },
        new ObservablePoint { X = 6, Y = 1 },
        new ObservablePoint { X = 8, Y = 6 },
    }
}
And it produces:

Fixes issues
- #583
- #579
- #575
- #578
- #570
- #562
- #555
- #552
- #525
- #515
What's Changed
- Zoom by section by @beto-rodriguez in https://github.com/beto-rodriguez/LiveCharts2/pull/581
- 2.0.0-beta.360 by @beto-rodriguez in https://github.com/beto-rodriguez/LiveCharts2/pull/590
Full Changelog: https://github.com/beto-rodriguez/LiveCharts2/compare/v2.0.0-beta.350...2.0.0-beta.360
Published by beto-rodriguez about 2 years ago
v2.0.0-beta.350 (An intro to high performance)
This release adds multiple improvements required by the LiveChartsCore.BackersPackage assembly, it is another assembly (not available in NuGet yet) that improves the performance of the library, adds multiple pre-built themes and much more extra features, we are testing this package and soon will be available for everyone.
The performance buff of this assembly is huge, this is a GIF I recorded with a chart with 300 million points, yes 300,000,000, about 20 GB of RAM (I am out of RAM can not test more points) and everything is super smooth, (the GIF speed is in real time, I am just zooming and panning quickly)

This performance is expected when the library "freezes" the plot, I mean when the data is not changing anymore, but If the data changes it seems that we can handle less than 2 million.
There are still things to improve but this is definitely the way for the library, it is jut a binary search based algorithm but optimized for the case of the library, I compared the time it takes to add 10 million points to different structures, here is the code and the results (net 6 | Release):

It seems that the data structure is actually faster than lists, and really close to arrays, this was an unexpected result, I am so happy with it :)
But that was the time it took to build the data structure, when the data does not change, we do not need to build the structure again, we cache it and then we use it to find the points the user need as he/she/* interacts with the chart (zooming or panning), it takes on average less than 2 milliseconds to find a new set of points (yes it is virtualized, we are of course not drawing the 300 million in the screen).
There are still a couple of issues we need to solve before making this public and I hope that the performance keeps this high.
Oh and I forgot to mention, all you need to change in your code is one line, and all your charts will be boosted.
LiveCharts.Configure(config => config.AddBackersPackageAndDefaults());
So that's it, there are no new things in this release, but there it is required to keep working in the high performance package.
Published by beto-rodriguez over 2 years ago
New Features
- Cartesian series now have the
DataLabelsTranslateproperty that let us align data labels with a lot of flexibility, for example:
- We can now place PieSeries labels at the
Outerposition
Improvements
Column, row, stacked column an stacked row series have a lot of improvements. Now StackedColumn inherits from Column series and StackedRow inherits from Row series, this fixed multiple issues because the code was dirty and hard to maintain.
Also column and row series are easier to read now, now bars that share the same secondary coordinate are drawn together.
old versions:
now:
The Padding property is new in bar series, it indicates the distance to the next bar and replaces the GroupPadidng propeprrty.
Deprecated
ColumnSeries.GroupPadidng, RowSeries.GroupPadidng, StackedColumnSeries.GroupPadidng, StackedRowSeries.GroupPadidng are obsoletes and were replaced by ColumnSeries.Padidng, RowSeries.Padidng, StackedColumnSeries.Padidng, StackedRowSeries.Padidng properties.
issues fixed
#502 and #504 fixed an issue where gaps were not generate properly in the LineSeries.
#497 fixed and issue where gauges labels color was not changing according to the theme.
#503 fixed a bug where the line series was kept in the UI even when the data was cleared.
#391 Tooltips are now placed correctly when the legend is visible.
Full Changelog: https://github.com/beto-rodriguez/LiveCharts2/compare/v2.0.0-beta.240...v2.0.0-beta.300
Published by beto-rodriguez over 2 years ago
Multiple issues fixed, https://github.com/beto-rodriguez/LiveCharts2/issues/477, https://github.com/beto-rodriguez/LiveCharts2/issues/470, https://github.com/beto-rodriguez/LiveCharts2/issues/462, https://github.com/beto-rodriguez/LiveCharts2/issues/286
What's Changed
- beta-240 by @beto-rodriguez in https://github.com/beto-rodriguez/LiveCharts2/pull/484
Full Changelog: https://github.com/beto-rodriguez/LiveCharts2/compare/v2.0.0-beta.230...v2.0.0-beta.240
Published by beto-rodriguez over 2 years ago
Fixed an issue where unloading then loading the control again caused the control to behave unexpectedly.
#457
What's Changed
- uno install guide by @beto-rodriguez in https://github.com/beto-rodriguez/LiveCharts2/pull/455
- beta-210 by @beto-rodriguez in https://github.com/beto-rodriguez/LiveCharts2/pull/458
- beta.220 by @beto-rodriguez in https://github.com/beto-rodriguez/LiveCharts2/pull/459
- Uno install by @beto-rodriguez in https://github.com/beto-rodriguez/LiveCharts2/pull/463
- Fixed memory leaks at least in WPF by @beto-rodriguez in https://github.com/beto-rodriguez/LiveCharts2/pull/469
- Reliability by @beto-rodriguez in https://github.com/beto-rodriguez/LiveCharts2/pull/472
- beta 2.0.0-230 by @beto-rodriguez in https://github.com/beto-rodriguez/LiveCharts2/pull/474
Full Changelog: https://github.com/beto-rodriguez/LiveCharts2/compare/beta.200...v2.0.0-beta.230
Published by beto-rodriguez over 2 years ago
This release introduces many new features: adds support for Uno Platform, a new web site, updates Maui to RC2,
adds support for Eto.Forms, improves drastically zooming and panning in touch devices (Uno, Maui and Xamarin).
Welcome Uno Platform
There was a step missing for LiveCharts2 to be a real cross platform library, LiveCharts2 is now in Uno Platform!
The LiveChartsCore.SkiaSharpView.Uno NuGet package provides 'ready-to-go' assemblies for Uno at UWP (10.0.18362), Wasm (net 6), Wpf (net 6), GTK (net 6) and Android (net 6). We keep working in the IOS, MacCatalyst and MacOS flavors.
New web site
You can now visit https://lvcharts.com/ to browse the samples, or to explore the assemblies in this repository.
Both (samples and API explorer) are generated automatically based on this repo, so feel free to create a PR in this repo to improve anything in the documentation.
Huge improvements to touch devices
In previous versions it worked in touch devices but it was using the same logic as desktop platforms, now zooming and panning feels natural in touch devices, you should now notice how the chart follows your fingers as you move the chart and it has also a cool bounce animation when you reach an edge, the following video was recorder in the Xamarin sample, but it is also implemented in Uno (Android) and Maui:
Welcome Eto.Forms
Thanks to @rafntor for adding the Eto.Forms View and the samples.
Updated Maui to RC2
Now Maui package is updated and working with RC 2, notice there is an issue in Maui rc2 detecting gestures https://github.com/dotnet/maui/issues/6553.
UWP package is obsolete now
The LiveChartsCore.SkiaSharpView.UWP will no longer receive new updates, instead it was replaced by LiveChartsCore.SkiaSharpView.Uno, just install the Uno package and everything will work as it used to, you also need to rename the namespaces from LiveChartsCore.SkiaSharpView.UWP to LiveChartsCore.SkiaSharpView.Uno.
Assemblies are not strong-named anymore
From MS docs and also GitHub:
For .NET Core and .NET 5+, strong-named assemblies do not provide material benefits. The runtime never validates the strong-name signature, nor does it use the strong-name for assembly binding.
Strong named assemblies will not be provided by the library anymore, but when you need strong named assemblies, I added the pack.ps1 file at the root of the repo, this tool helps you to build and pack the assemblies in the library, then it is up to you to strong name them.
Multiple fixed issues.
See the links to the prs bellow.
What's Changed
- Things have changed in the process... just some cleanup by @beto-rodriguez in https://github.com/beto-rodriguez/LiveCharts2/pull/379
- Port to Eto.Forms by @rafntor in https://github.com/beto-rodriguez/LiveCharts2/pull/388
- Improve wording and grammar by @evanknapke in https://github.com/beto-rodriguez/LiveCharts2/pull/398
- Vector manager by @beto-rodriguez in https://github.com/beto-rodriguez/LiveCharts2/pull/408
- Remove map obsoletes by @beto-rodriguez in https://github.com/beto-rodriguez/LiveCharts2/pull/414
- ci by @beto-rodriguez in https://github.com/beto-rodriguez/LiveCharts2/pull/415
- Fix Build issue with Maui by @ChrisPulman in https://github.com/beto-rodriguez/LiveCharts2/pull/433
- Welcome Uno by @beto-rodriguez in https://github.com/beto-rodriguez/LiveCharts2/pull/442
- Fixed LegendBackground color issue and Binding exceptions for conversion to double (Xamarin Forms and Maui) by @vadimffe in https://github.com/beto-rodriguez/LiveCharts2/pull/440
- Multiple minor fixes by @beto-rodriguez in https://github.com/beto-rodriguez/LiveCharts2/pull/446
- Improvements for zooming and panning by @beto-rodriguez in https://github.com/beto-rodriguez/LiveCharts2/pull/447
- Fixed a bug in the axis that could cause an incorrect size of area for the labels if _forceStepToMin is true by @MarcF12 in https://github.com/beto-rodriguez/LiveCharts2/pull/438
- Correct spelling, fix case for domInterop.js by @erichiller in https://github.com/beto-rodriguez/LiveCharts2/pull/427
- Multiple fixes by @beto-rodriguez in https://github.com/beto-rodriguez/LiveCharts2/pull/448
- Cleanup by @beto-rodriguez in https://github.com/beto-rodriguez/LiveCharts2/pull/449
- Fix Persian and Arabic text(label) rendering by @raminmjj in https://github.com/beto-rodriguez/LiveCharts2/pull/421
- Uno.mobile by @beto-rodriguez in https://github.com/beto-rodriguez/LiveCharts2/pull/452
- beta-200 by @beto-rodriguez in https://github.com/beto-rodriguez/LiveCharts2/pull/454
New Contributors
- @rafntor made their first contribution in https://github.com/beto-rodriguez/LiveCharts2/pull/388
- @evanknapke made their first contribution in https://github.com/beto-rodriguez/LiveCharts2/pull/398
- @ChrisPulman made their first contribution in https://github.com/beto-rodriguez/LiveCharts2/pull/433
- @vadimffe made their first contribution in https://github.com/beto-rodriguez/LiveCharts2/pull/440
- @MarcF12 made their first contribution in https://github.com/beto-rodriguez/LiveCharts2/pull/438
- @erichiller made their first contribution in https://github.com/beto-rodriguez/LiveCharts2/pull/427
- @raminmjj made their first contribution in https://github.com/beto-rodriguez/LiveCharts2/pull/421
Full Changelog: https://github.com/beto-rodriguez/LiveCharts2/compare/beta.100...beta.200
Published by beto-rodriguez over 2 years ago
Fixed an important memory leak, improved Avalonia, new event to handle the case where points overlap easily.
What's Changed
- Axes fixes by @beto-rodriguez in https://github.com/beto-rodriguez/LiveCharts2/pull/328
- Legends/tooltips review by @beto-rodriguez in https://github.com/beto-rodriguez/LiveCharts2/pull/345
- Docs by @beto-rodriguez in https://github.com/beto-rodriguez/LiveCharts2/pull/336
- Docs by @beto-rodriguez in https://github.com/beto-rodriguez/LiveCharts2/pull/351
- Fixes #355 (UWP compatibility issue with Win10 build 17763) by @jnayee in https://github.com/beto-rodriguez/LiveCharts2/pull/358
- Memory leaks by @beto-rodriguez in https://github.com/beto-rodriguez/LiveCharts2/pull/360
- Concurrency by @beto-rodriguez in https://github.com/beto-rodriguez/LiveCharts2/pull/368
- A review to simplify events by @beto-rodriguez in https://github.com/beto-rodriguez/LiveCharts2/pull/371
Full Changelog: https://github.com/beto-rodriguez/LiveCharts2/compare/beta.90...beta.100
Published by beto-rodriguez almost 3 years ago
Highlights
- The Maui package is now available on NuGet
- Assemblies are now strong-named
- Updated WinUI package to
WindowsAppSdk 1.0 - New events to detect when the pointed goes down or hovers over a point, checkout the
samples/{ platform }/Events


What's Changed
- Setting foreground and background for default legend in UWP by @pino951 in https://github.com/beto-rodriguez/LiveCharts2/pull/269
- fixed polar bug by @dmedine in https://github.com/beto-rodriguez/LiveCharts2/pull/272
- WinUI references update by @alex4998 in https://github.com/beto-rodriguez/LiveCharts2/pull/299
- Maui view by @beto-rodriguez in https://github.com/beto-rodriguez/LiveCharts2/pull/279
- Pointer events, tooltips review by @beto-rodriguez in https://github.com/beto-rodriguez/LiveCharts2/pull/305
- Pointer down events by @beto-rodriguez in https://github.com/beto-rodriguez/LiveCharts2/pull/309
- Apply fixes from CodeFactor by @beto-rodriguez in https://github.com/beto-rodriguez/LiveCharts2/pull/313
- code cleanup by @beto-rodriguez in https://github.com/beto-rodriguez/LiveCharts2/pull/311
- Code quality by @beto-rodriguez in https://github.com/beto-rodriguez/LiveCharts2/pull/314
- code quality by @beto-rodriguez in https://github.com/beto-rodriguez/LiveCharts2/pull/315
New Contributors
- @pino951 made their first contribution in https://github.com/beto-rodriguez/LiveCharts2/pull/269
- @dmedine made their first contribution in https://github.com/beto-rodriguez/LiveCharts2/pull/272
- @alex4998 made their first contribution in https://github.com/beto-rodriguez/LiveCharts2/pull/299
Full Changelog: https://github.com/beto-rodriguez/LiveCharts2/compare/beta.80...beta.90
Published by beto-rodriguez almost 3 years ago
Blazor Web Assembly version
This release includes the Blazor WebAssembly package, we can now run LiveCharts in the browser using dotnet 6 rc2, it is an early version but most of the features are supported now.
WinUI version
The WinUI package was updated from PrjectReunion 0.8.0 to Microsoft.WindowsAppSDK experimental-1 package.
Maui version
Maui keeps evolving and changing a lot every in every preview, the development of this package is paused by now.
Fixed issues
- Fixed UWP NuGet package installation issues #145.
- Fixed WinUI NuGet package installation issues #192 #212
- Fixed an issue where the series could disappear from the UI #235
- Fixed a possible NRE, see #244 (@Maximilian-Renner)
- Fixed an issue where tooltips were not fired in the accurate position (@wenya90)
- Fixed an issue where charts were not saving as images #231 (@aspion-ae).
- Improved maps, maps have a new API that enables animations and will support more shapes in a map, such as indicators and new series #197 #209 #224, there is some work to do there yet but this is a good start.
Breaking changes
Sadly the maps API has changed, it is a necessary change to build better maps, it is a small but breaking change, see #197 for more info.
Automatically generated release notes start here
What's Changed
- Fix MotionCanvas to support dynamic loading/unloading by @mark-monteiro in https://github.com/beto-rodriguez/LiveCharts2/pull/109
- Allow WinUI MotionCanvas to be unloaded/re-loaded correctly by @mark-monteiro in https://github.com/beto-rodriguez/LiveCharts2/pull/110
- Support null values in DateTimePoint constructor by @mark-monteiro in https://github.com/beto-rodriguez/LiveCharts2/pull/113
- Bugfix 100 by @LabuzzMichal in https://github.com/beto-rodriguez/LiveCharts2/pull/111
- Scale
Sectioncoordinates correctly by @mark-monteiro in https://github.com/beto-rodriguez/LiveCharts2/pull/117 - Uwp by @beto-rodriguez in https://github.com/beto-rodriguez/LiveCharts2/pull/118
- fixes #63 by @beto-rodriguez in https://github.com/beto-rodriguez/LiveCharts2/pull/125
- Fix onepoint display by @powerpdw in https://github.com/beto-rodriguez/LiveCharts2/pull/121
- readme: fix typos by @swharden in https://github.com/beto-rodriguez/LiveCharts2/pull/127
- Load Theme Correctly in
DrawMarginFrameby @mark-monteiro in https://github.com/beto-rodriguez/LiveCharts2/pull/130 - Polarchart by @beto-rodriguez in https://github.com/beto-rodriguez/LiveCharts2/pull/157
- No system.drawing by @beto-rodriguez in https://github.com/beto-rodriguez/LiveCharts2/pull/158
- Fixes visibility issues by @beto-rodriguez in https://github.com/beto-rodriguez/LiveCharts2/pull/178
- Fixes display scaling in UWP by @jnayee in https://github.com/beto-rodriguez/LiveCharts2/pull/179
- Fixes reattach visual scaling in UWP & WinUI by @jnayee in https://github.com/beto-rodriguez/LiveCharts2/pull/181
- new maps API by @beto-rodriguez in https://github.com/beto-rodriguez/LiveCharts2/pull/197
- New maps api 2 by @beto-rodriguez in https://github.com/beto-rodriguez/LiveCharts2/pull/209
- Improvements to maps by @beto-rodriguez in https://github.com/beto-rodriguez/LiveCharts2/pull/224
- Fixed issue #198, removed duplicate code by @aspion-ae in https://github.com/beto-rodriguez/LiveCharts2/pull/231
- Visibility issues by @beto-rodriguez in https://github.com/beto-rodriguez/LiveCharts2/pull/235
- Bugfix WPF: Chart.cs and GeoMap.cs by @Maximilian-Renner in https://github.com/beto-rodriguez/LiveCharts2/pull/244
- Blazor wasm by @beto-rodriguez in https://github.com/beto-rodriguez/LiveCharts2/pull/239
- fix Line and Scatter point mesure, TooltipFindingStrategy by @wenya90 in https://github.com/beto-rodriguez/LiveCharts2/pull/246
New Contributors
- @mark-monteiro made their first contribution in https://github.com/beto-rodriguez/LiveCharts2/pull/109
- @powerpdw made their first contribution in https://github.com/beto-rodriguez/LiveCharts2/pull/121
- @swharden made their first contribution in https://github.com/beto-rodriguez/LiveCharts2/pull/127
- @jnayee made their first contribution in https://github.com/beto-rodriguez/LiveCharts2/pull/179
- @aspion-ae made their first contribution in https://github.com/beto-rodriguez/LiveCharts2/pull/231
- @Maximilian-Renner made their first contribution in https://github.com/beto-rodriguez/LiveCharts2/pull/244
- @wenya90 made their first contribution in https://github.com/beto-rodriguez/LiveCharts2/pull/246
Full Changelog: https://github.com/beto-rodriguez/LiveCharts2/compare/2.0.0-beta.33...beta.80
Published by beto-rodriguez about 3 years ago
- Fixed multiple visibility issues #178
- Fixed scaling canvas issues for UWP and WinUI #179
Published by beto-rodriguez about 3 years ago
- Polar charts are supported now
- Fixed an issue where labels were not measured properly, it was affecting Gauges directly
- Removed the dependency to System.Drawing namespace
- Added
IsVisibleproperty to sections - Improved how the library applies themes
- Fixed an issue in WPF when the update comes from another thread different from the UI thread
- Added support for animations using key frames
- Improved designer #164
- Fixed multiple issue when adding/removing controls from the visual tree #133 #163 #162
- #165 Load SkiaSharp fonts easier
Breaking changes
#158 Sadly this is the first release that has breaking changes, but the changes are minimal and might not apply for everyone using the library.
Any property of type System.Drawing.Color now should use LiveChartsCore.Drawing.LvcColor.
Any property of type System.Drawing.SizeF now should use LiveChartsCore.Drawing.LvcSize.
Any property of type System.Drawing.PointF now should use LiveChartsCore.Drawing.LvcPoint.