Bot releases are hidden (Show)
There are no code changes in this release (only comments)
Unfortunately Netlify (who have been hosting our examples website) have decided (without any warning apart from a post to their own forum) to stop redirecting from our elm-visualization.netlify.com to elm-visualization.netlify.app domain.
This broke all the links to our documentation resources. And since those are immutable, we can't really fix that. This release now fixes the links and images to go to the .app domain (thanks to @Anton-4 for reporting and fixing this).
We may consider changing this again to our own domain, however, we wanted to expedite this fix to keep the docs nice and available.
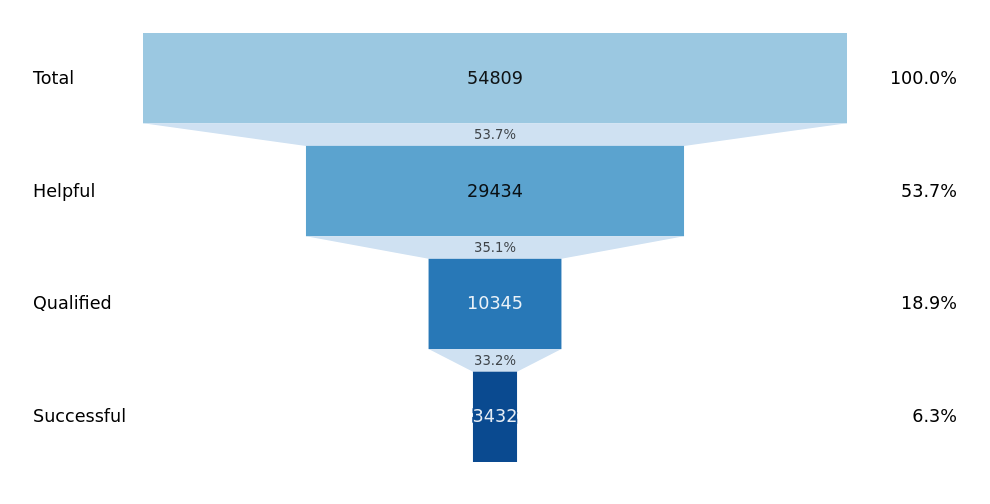
As a small consolation prize for any trouble caused by this, we are adding a new Funnel chart example:
Published by gampleman 7 months ago
This patch release fixes some dependency related issues:
- Due to a GitHub username rename, some packages were broken and these have been replaced with their newer versions.
- Upgrades to core-extra.
Published by gampleman about 1 year ago
Hierarchy
A new module which provides various layout algorithms for dealing with tree-like data structures.
We provide a "tidy" algorithm for doing classical node-link diagrams, which supports both a typical layered approach where each level of children are laid out on a separate layer, as well as the more space efficient non-layered option:
Apart from that, we also provide a classical treemap layout, with several different partitioning algorithms (and as usual, you can bring your own partitioning algorithm):
Finally, we also ship a partition layout, that can be used for various forms of layout, for instance a nice interactive sunburst chart:
This functionality is powered by the brand new gampleman/elm-rosetree library, that is now a dependency.
Shape.bumpX and Shape.bumpY
We added two new curve types that are particularly handy for generating those nice curved connectors for vertical and horizontal tree layouts.
Interpolation and Animation Improvements
Interpolation gets a nice Interpolation.pointAlongPath function that allows interpolating a ( Float, Float ) position based on an arbitrary path. This can quickly lead to some very neat animations.
Staggering multiple animations has also been a feature we've long wanted to add. Interpolation now has a relatively abstract Interpolation.staggeredWithParallelism which staggers animations based on how many (on average, as there is a ramp up and ramp down period) you want to run at the same time. Perhaps more intuitive to traditional animation approaches is Transition.staggered which offers less abstract control based on duration for each animation and delay till the next one starts in actual milliseconds, as well as adding easing to each animation separately.
Transitions now have a concept of repetition, where animations can repeat either from the beginning or alternate running back-to-front.
Documentation
First and foremost, we now have an official elm-visualization tutorial: elm-visualization - An introduction. This should be a handy resource for getting started with the library, since it presents the concepts in an order of importance to day-to-day tasks and skips over some of the more complex options, focusing on some of the most important daily drivers.
Apart from the examples featured above, we now have two new examples that among other things showcase some techniques for label placement:
and
Bugfixes
This release fixes a bug in Force that caused division by zero errors when two entities occupied the exact same point. The algorithm will now move one of them a minuscule amount in an arbitrary direction before continuing the computation (since we expect the forces will move the entities a much larger amount, this should not cause any noticeable trouble).
Project improvements
The project has upgraded elm-test to v2, migrated to GitHub actions, and started using elm-review. This makes it easier to contribute as much of the code quality process is now automated.
Acknowledgments
Many thanks to @FuJa0815 and @lucamug for fixing typos in the docs this release.
Published by gampleman over 3 years ago
Brush Interaction

This release adds a brush module that allows the user to select rectangular regions of a visualisation. The Brush module supports single dimensional brushing in the x and y directions as well as a two dimensional brush:

Programmatic Zoom Control
The Zoom module gains the new setTransform, which allows you to control the zoom behaviour programmatically.
Published by gampleman over 3 years ago
For some time we have been adding major features to elm-visualization. However, often these features were in an MVP form and the time has come to flesh these out and provide more options to our modules. This release has been more than a year in the making and ships a huge number of improvements.
Force
The force module adds several new forces that you can use to adjust force based layouts:
-
Force.collisionandForce.customCollisionprovide a 2D collision detection system. This can be useful for avoiding overlap if you have larger nodes or making beeswarm plots. -
Force.towardsXandForce.towardsYallow you to attract nodes to a specific X or Y position. -
Force.customRadialis similar, but positions nodes to the nearest point on a specified circle.
Interpolation
Interpolation .hcl, Interpolation.hclLong and Interpolation.lab join the existing Interpolation.rgb, Interpolation.rgbWithGamma and Interpolation.hsl as ways to interpolate between colours. These new interpolators are better in being more perceptually uniform and can be more suitable for use in Scales (or even for animations by skipping some ugly washed out colours).
Many thanks to @deciob for adding these.
Scale
This release adds 13 new scales:
-
Scale.radialis a new type of continuous scale that is suitable for when a marks circular area is proportional to the value represented. -
Scale.divergingis likeScale.sequential, but includes a middle neutral point. Can be used for things where there is a natural zero and things above or below, like temperature in degrees or political leaning. -
Scale.quantilemaps a sampled input domain to a discrete range. The number of values in the output range determines the number of quantiles that will be computed from the domain. -
Scale.thresholdallows you to chunk your continuous data into arbitrary segments:temperatureScale = threshold ( blue, [ ( 0, yellow ), ( 200, red )])would be blue under 0, yellow between 0 and 200, and red otherwise.
-
Scale.pointscales are a variant of band scales with the bandwidth fixed to zero. Point scales are typically used for scatterplots with an ordinal or categorical dimension. -
Scale.symlogis a continuous scale which is similar to a log scale, but is suitable to be used with datasets that pass zero.
Finally, we implement transformed versions for sequential and diverging scales: sequentialLog, sequentialPower, sequentialSymlog, divergingLog, divergingPower, divergingSymlog. These are just like the continuous versions, but use an interpolator instead of a ( Float, Float ) range.
Scale.nice for continuous scales now runs to a fix point, so applying it more than once will now make no difference. This should also make nice slightly... well... nicer.
Scale.Color
Scale.Color adds a dizzying 52 new built-in color schemes:

Many thanks to @deciob for adding these.
Statistics
Adds a peaks function for automatically detecting peaks in time series:
Transition
The transition module adds 21 new easing functions to customise how animations progress: easeBack, easeBackIn, easeBackOut, easeBounce, easeBounceIn, easeBounceOut, easeCircle, easeCircleIn, easeCircleOut, easeElastic, easeElasticIn, easeElasticOut, easeExponential, easeExponentialIn, easeExponentialOut, easePolynomial, easePolynomialIn, easePolynomialOut, easeSinusoidal, easeSinusoidalIn, and easeSinusoidalOut.
Zoom
A small bug with detecting mouse position in some SVG context has been fixed.
Many thanks to @woylie for contributing this.
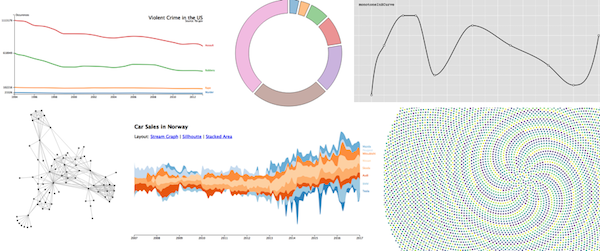
Examples
Our examples website has been streamlined with a slight redesign. The examples are now divided into categories to make everything a bit easier to navigate. Examples now include the data they need to run (thanks @Anton-4), show a link to an editable Ellie and have been refactored slightly to make them easier to follow (thanks again @Anton-4) and some smaller issues have been fixed (thanks @megapctr).
Furthermore a number of new examples have been added (thanks to @woylie, @Anton-4, and @deciob for contributing many of these).
Published by gampleman about 4 years ago
This release upgrades the dependency on elm-geometry. This will allow you to use elm-geometry and elm-visualization together without needing to worry about version conflicts.
Also you will find ianmackenzie/elm-units-prefixed helpful if you would like to use both packages together.
Many thanks to @ianmackenzie and @pd-andy who helped make this release possible.
Published by gampleman almost 5 years ago
Ooops! Forgot to update some links in the README that resulted in 404s. This patch release fixes that.
Published by gampleman almost 5 years ago
Version 2.1 of elm-visualization focuses on helping you provide interactivity to your data visualisations. Here is an overview of the additions:
Interpolation
Interpolation is simply a smooth path between a starting value and an ending value. We model these as a function that takes a Float in the range (roughly) 0..1, where 0 is the starting value and 1 is the ending value. The provided Interpolation module provides some basic interpolation functions for common types, as well as many ways to compose these interpolators for more complex types.
The good news is that the Elm ecosystem already has interpolators for many types in the wild, for example elm-geometry or elm-units.
Interpolation has many uses in data viz. They are perfect for making sequential scales or for animation.
Transition
The Transition module makes animations out of Interpolators. The basic idea is this:
- You make an interpolator for some intermediate representation of your data (i.e. this is the data you wish to visualise, potentially with a few further attributes calculated, but not a
Html Msg). - You build a
viewfunction that does the data viz based on this intermediate representation. - In your
updateyou createTransitionfrom your Interpolator. You give it a duration and optionally some easing. - You subscribe to
Browser.Events.onAnimationFrameDeltaand step your Transition.
This allows you to define even highly complex animations with relative ease. The main power here is in the Interpolators, as they make it easy to compose animations.
We've also added a new example of complex animation:

Zoom
Often in data visualisation we want to support users to both get a high level overview of the data, but at the same time allow them to explore the fine details. A useful technique is to allow panning and zooming. Unfortunately implementing this correctly in a cross-browser/device way is quite tricky. This release adds the Zoom module, that implements the many event listeners and bookkeeping necessary for doing this.
There's also a new example on how to use it (in combination with a WebGL based visualisation):

Minor Changes
-
Scale.Color.tableau10has been added for a new, attractive categorial palette. - The examples website has been rewritten in Elm and published on Netlify. The new URL is
https://elm-visualization.netlify.com, so please update any links you may maintain. The old examples site will stay online for some time, but is now officially deprecated. (Also please excuse any minor bugs or issues with the new website. We will iron them out over the course of time. Contributions welcome ;-)). - Some documentation was updated to clarify domains and ranges in scales.
Published by gampleman over 5 years ago
Force.customLinks now no longer ignores the iteration count argument. This allows to specify more rigid link constraints for doing things like lattices.
Published by gampleman about 6 years ago
I'm happy to announce version 2.0. Here are the highlights:
0.19 Compatibility
Elm 0.19 among other things brings dead code elimination, so Elm-visualization can now be used on projects that only require a function or two.
Ecosystem Integration
Elm-visualization now more relies on great community packages. Colors use avh4/elm-color, path use folkertdev/one-true-path-experiment and
our examples are written in elm-community/typed-svg.
API Refinements
All of the APIs should still be familiar from 1.x, but a number of small developer usability improvements have been made.
Now for the detailed changelog:
All modules have dropped the Visualization prefix.
Scales
-
Important: The order of arguments for constructing scales has switched from
domain -> rangetorange -> domain. This better fits how scales are often constructed, where the domain is computed in a pipeline. Unfortunately forlinear,logand potentiallyordinalscales, this will not result in type errors when upgrading. So remember to grep for these in your codebase and update the call sites. If you see wildly messed up visualizations after the upgrade, this is the most likely cause. -
In order to help with this,
ContinuousScalenow takes a type argument (typicallyFloat) andContinuousTimeScaleis nowContinuousScale Time.Posix. So if you have explicit type annotations for your scales, the compiler can possibly help here. -
Scale.nicehas also switched argument order to better support pipeline style. -
Scale.identitynow actually takes a(Float, Float)argument, which should make it much more useful. -
The docs have been restructured a bit.
-
The color interpolation and scheme functions have been moved out of
Scaleinto their own moduleScale.Color. I anticipate we may add many more color schemes in the future and theScalemodule is already pretty crowded. -
The
scheme20... functions have been removed. They are not great for accessibility as many of the color combinations they produce are hard to distinguish. If you still need them, you can easily copy their source code into your project. -
Log scales now generate ticks much more reliably. The default tick formatting now produces much better default formats.
-
toRenderablenow takes a toString function -
time scales now operate with the new
Posix.Time. As such they also need aTime.Zoneattribute that represents the timezone in which the data should be displayed.
Axes
-
The view function now accepts a list of attributes rather than a record. This makes it more like other view functions. It also eliminates some of the
Maybetypes, since the default behavior can now be triggered by simply omitting the relevant attributes. -
The
axisfunction has been split into orientation relevant ones:left,right,bottom,top.
import Visualization.Axis as Axis exposing (defaultAxisOptions, Orientation(..))

main = Axis.axis { defaultAxisOptions | ticks = Just [ 5, 3, 1 ], orientation = Top } myScale
now becomes
import Axis

main = Axis.top [ Axis.ticks [ 5, 3, 1 ] ] myScale
Shape
-
arc,line,lineRadial,area, andareaRadialnow return aPath(from the one-true-path-experiment package) rather than a string. -
Curve functions have changed their type (from
Curve -> List PathSegmenttoList (Float, Float) -> SubPath), now they are mere aliases to the underlying one-true-path-experiment functions. -
It is now easy to implement your own curve function, since the
Curvetype was replaced withList (Float, Float) -
The
Pointtype alias has been removed in the docs.
Statistics
-
Visualization.Listhas been renamed toStatistics. -
extentWithhas been renamed toextentBy. A new function calledextentWith : (a -> a -> Order) -> List a -> Maybe ( a, a )has been added. -
Added three new functions:
variance,deviation,quantile. -
rangehas changed fromnumber -> number -> number -> List numbertoFloat -> Float -> Float -> List Float. This has enabled using a much faster and more precise implementation.
Force
-
Many-body force now uses a QuadTree implementation under the hood. This turns the algorithm from O(n²) to O(n log(n)) and generally improves performance. However, this may lead to slightly different layouts.
-
Adds a
customManyBody : Float -> List ( comparable, Float ) -> Force comparablewhich adds full control over the many body simulation including controlling the level of approximation. This allows you to disable the optimization mentioned above if necessary.
Examples
-
All example code has been changed from elm/svg to elm-community/typed-svg. This is inline with best practice, as anyone who's serious about graphics programming in elm should not use elm/svg. It has almost no type safety and litters your code with
String.fromFloatcalls. The examples now lead you to this, and consequently the code is a bit simpler. -
The example website has been spruced up a bit.
Acknowledgments
Many thanks to @folkertdev for contributing the QuadTree optimization.
Thanks to Salomon Turgman, @ianmackenzie and @dmy for helping improve the documentation.
Thanks to @justinmimbs and @folkertdev for updating/redesigning/fixing dependencies.
Published by gampleman over 6 years ago
Updates list-extra to v7 to help compatibility.
Published by gampleman almost 7 years ago
This release changes a lot of the code under the hood. The main change is our migration to use folkertdev/one-true-path-experiment for handling paths. Therefore Visualization.Path is now deprecated and will be removed on the next major release.
To ease transition, there is a function that allows converting things in the current format for paths into something compatible with that package.
This means we now support an impressive list of Curve functions:
linearCurvebasisCurveOpenbasisCurvebasisCurveClosedbundleCurvecardinalCurvecardinalCurveClosedcardinalCurveOpencatmullRomCurvecatmullRomCurveClosedcatmullRomCurveOpenmonotoneInXCurvemonotoneInYCurvestepCurvenaturalCurve
We also added radial versions of Shape.line and Shape.area.

Finally, the text formatting of Scale.tickFormat has been improved for Linear Scales.
Published by gampleman about 7 years ago
Stacks
This release brings in functions to construct stacked charts. This enables the obvious charts:
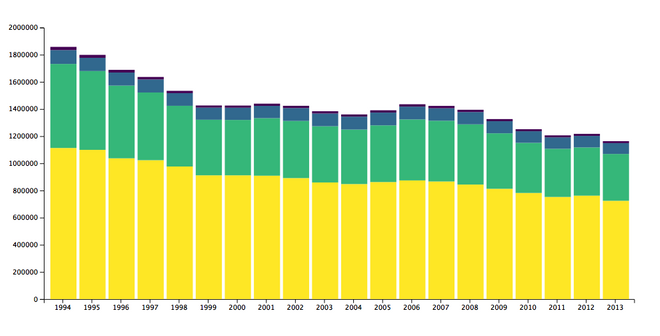
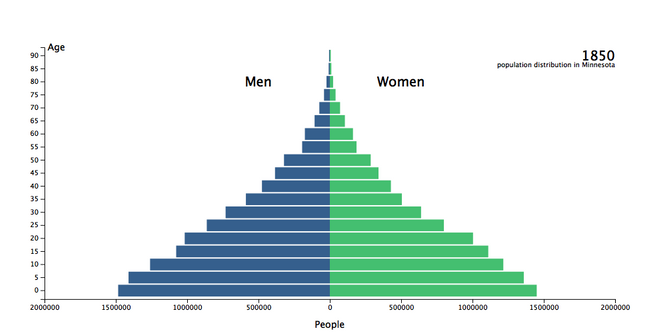
What's awesome is that this also enables you to build streamgraphs:
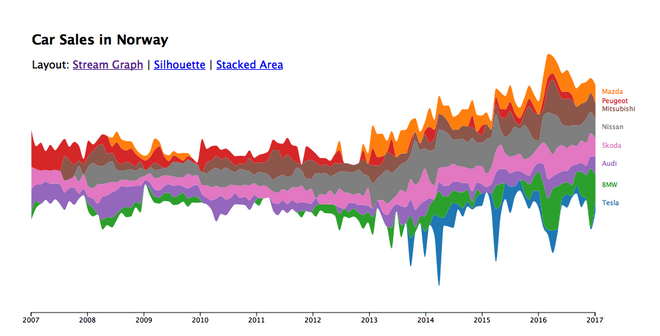
Check out the Stack docs!
Many thanks to @folkertdev for contributing the code that makes up this release!
Published by gampleman over 7 years ago
Histogram
Adds a new module for computing Histograms from data.
Scales
-
Added
OrdinalScales -
Added
BandScales that can be made compatible with Axis viaScale.toRenderable -
Added
category10,category20a,category20b,category20cordinal color schemes -
Added
infernoInterpolator,magmaInterpolatorandplasmaInterpolatorcolor interpolators -
Documentation improvements
-
Fixes QuantizeScales not working properly
-
Fixes quirky behavior in
Visualization.List.range
Published by gampleman over 7 years ago
Force Layout
This release adds the ability to visualize for example network graphs via a force based layout module.
Published by gampleman over 7 years ago
Adds a viridisInterpolator for nice color scales.
Published by gampleman over 7 years ago
Clarifies docs regarding using Axis with continuous scales.
Published by gampleman almost 8 years ago
- Adds arc generators
- Improves documentation with pictures and examples
- Updated for elm 0.18
Published by gampleman about 8 years ago
Initial release featuring:
- Scales to transform data from data space to screen space:
- Linear
- Log
- Time
- Sequential
- Quantize
- Axis to render scales on screen
- Shape generator for generating chart shapes
- A canvas inspired abstraction over SVG paths
- Some utilities for handling data.