
localtileserver
🌐 dynamic tile server for visualizing rasters in Jupyter with ipyleaflet or folium
MIT License
Published by banesullivan 9 months ago
What's Changed
- Release 0.10.0: migration to rio-tiler by @banesullivan in https://github.com/banesullivan/localtileserver/pull/183
This release marks a significant re-implementation of localtileserver. The backing tiler has been changed from large-image to rio-tiler. The overall result is improved performance, simplified dependencies, improved compatibility with the rasterio ecosystem, and many bug/quirk fixes like #172, #159, #147
This release unfortunately has many breaking changes and some loss of features. The breaking changes are mostly around API renaming and some methods changing to properties. Otherwise, I stripped out features that are just better handled upstream or not needed here.
This may be a painful upgrade considering how much has changed. Highlights:
-
bandis nowindexesto follow rio-tiler's implementation (deprecation warning is issued in parts of the API) -
cmapis nowcolormap(deprecation warning is issued in parts of the API) -
paletteis nowcolormap - Custom colormaps are no longer supported
- No more region of interest extraction
- Access to underlying
rasteriodataset is now via the.datasetproperty - COG validation no longer raises errors, but returns a True/False
-
metadata()method is now ametadataproperty - No more support for remote servers (niche feature)
- Some return values of things like bounds, metadata, etc may have changed now that they are fetched from rio-tiler
For those looking for more details, I recommend checking out the diff specifically for the test directory to see what has changed in #183
Published by banesullivan over 1 year ago
This release significantly changes in the dependencies of localtileserver (switching from GDAL to rasterio), focuses on geospatial applications by dropping non-geo support, includes optimizations to TileClient to avoid REST operations, and majorly refactors the internal code for future development.
What's Changed
- Switch to rasterio by @banesullivan in https://github.com/banesullivan/localtileserver/pull/154
- Internal refactoring by @banesullivan in https://github.com/banesullivan/localtileserver/pull/155
- An improved TileClient that avoids the REST interface where possible by @banesullivan in https://github.com/banesullivan/localtileserver/pull/156
Full Changelog: https://github.com/banesullivan/localtileserver/compare/0.6.4...0.7.0
Published by banesullivan over 2 years ago
New features:
- Add COG validate helper (see #80)
- Enable
*CORS by user choice - Add
is_geospatialproperty toTileClient - Add
default_zoomproperty toTileClientto determine starting zoom on map - Handle tile serving in pixel coordinates for non-geospatial images
Niceties:
- Handle
large_imagesource as input toTileClient - Add
_ipython_display_toTileClientto quickly display a map in Jupyter - Add
_repr_png_toTileClientto quickly show a thumbnail in Qt IPython - Add URL form field to web app
Maintenance:
- Maintenance of Docker images
- Internal refactoring to utilize new
server-threadpackage (see #79) - Documentation and examples improvements
Published by banesullivan over 2 years ago
- Style parameters can now be included as a JSON blob in the request body following the format specified by large-image or as a
dictin thesyleparameter in the Python client. -
cmapalias forpalettein Python client (see #71) - Better error handling
- Handle Dropbox URLs
- New
save_new_rasterhelper method - Bug fixes, cleanup, and other internal maintenance (see diff)
This release adds support for rasterio datasets so that users can easily visualize their data when working with rasterio:
import rasterio
from ipyleaflet import Map
from localtileserver import TileClient, get_leaflet_tile_layer

# Open raster with rasterio
src = rasterio.open('path/to/geo.tif')

# Pass rasterio source to localtileserver
client = TileClient(src)

t = get_leaflet_tile_layer(client)

m = Map(center=client.center(), zoom=8)
m.add_layer(t)
m
Published by banesullivan over 2 years ago
This release adds support for using localtileserver in remote Jupyter environments (e.g., MyBinder or JupyterHub) through jupyter-server-proxy. Included in this release is a new Docker image on GitHub's package registry for using localtileserver in Jupyter.
docker pull ghcr.io/banesullivan/localtileserver-jupyter:latest
docker run -p 8888:8888 ghcr.io/banesullivan/localtileserver-jupyter:latest
To configure this in your own set up, you must set the following environment variables
-
LOCALTILESERVER_CLIENT_PREFIX='proxy/{port}'- Same for everyone usingjupyter-server-proxy - Optional:
-
LOCALTILESERVER_CLIENT_HOST=127.0.0.1- The host on which you launch Jupyter (the URL/domain of the Jupyter instance if using MyBinder or JupyterHub) -
LOCALTILESERVER_CLIENT_PORT=8888- The port on which you launch Jupyter (leave blank if using MyBinder or JupyterHub)
-
There is a demo in https://github.com/banesullivan/localtileserver-demo that shows how this will work on MyBinder by setting the following at run-time:
# Set host forwarding for MyBinder
import os
os.environ['LOCALTILESERVER_CLIENT_PREFIX'] = f"{os.environ['JUPYTERHUB_SERVICE_PREFIX'].lstrip('/')}/proxy/{{port}}"
Resolves #29, #66, and https://github.com/banesullivan/localtileserver-demo/issues/1
Published by banesullivan almost 3 years ago
This release has one breaking change (breaking for a small minority of users) where the API endpoints were renamed to have the api/ prefix where applicable (see #51). Other notes:
- Document style parameters for Thumbnail endpoint (see 7e27db045b7798ba191f0b4350928eda17625c15)
- Support custom, user-defined palettes (see #54)
- Cesium Split Viewer (see #47 and https://github.com/banesullivan/localtileserver/discussions/53)
- Cesium terrain model is now disabled by default (see fe1c2103aa13cbdc49eb5ec2e785e3a35b8907b8)
Standalone Docker Image - #57
Now you can easily pull a docker image for the latest release or for a specific Pull Request in the repository. Check out the tags for https://github.com/banesullivan/localtileserver/pkgs/container/localtileserver
This is particularly useful if you do not want to install GDAL on your system or want a dedicated service for tile serving.
To use the docker image:
docker pull ghcr.io/banesullivan/localtileserver:latest
docker run -p 8000:8000 ghcr.io/banesullivan/localtileserver:latest
Then visit http://0.0.0.0:8000 in your browser. You can pass the ?filename= argument in the URL params to access any URL/S3 file.
Note that you can mount your file system to access files locally. For example, I mount my Desktop by:
docker run -p 8000:8000 -v /Users/bane/Desktop/:/data/ ghcr.io/banesullivan/localtileserver:latest
Then I can add the ?filename= parameter to the URL to access the file TC_NG_SFBay_US_Geo.tif file on my desktop. Since this is mounted under /data/ in the container, you must build the path as /data/TC_NG_SFBay_US_Geo.tif, such that the URL would be http://0.0.0.0:8000/?filename=/data/TC_NG_SFBay_US_Geo.tif (or http://0.0.0.0:8000/?filename=%2Fdata%2FTC_NG_SFBay_US_Geo.tif)
Published by banesullivan almost 3 years ago
Bye-bye, Python 3.6! 👋🏻
This release introduces an override to ipyleaflet.TileLayer that constrains the region of requested tiles, per jupyter-widgets/ipyleaflet#888. This significantly reduces the load on the tile server when viewing tiles in an ipyleaflet.Map
This change required dropping Python 3.6 and was good timing since Python 3.6's Security Support ended Dec 23, 2021 (4 days ago) (ref https://endoflife.date/python). Since conda-forge hasn't been building on Python 3.6 for some time, I'm hoping there is minimal impact here
Published by banesullivan almost 3 years ago
The last few tags have been full of useful/nice to have features and clean up. The follow is a recap
- Multi-band support: create composite images from selected bands
- Automatically opens web browser when launching from command line
- Under the hood improvements and abstraction of the underlying flask app to a Blueprint
- Major UI improvements with color mapping options
- Support user provided CesiumIon tokens
- Support memcached
- Better handle bad filenames/URLs with 404 page
- Improvements to CesiumJS and GeoJS tile viewers
- Google Analytics support
- New pixel endpoint
- New Histogram endpoint
- New tile sources endpoint
- New colormaps listing endpoint
Swagger API Docs
There is now an /swagger/ view with full API documentation:
| List | Tiles |
|---|---|
This introduced a new flask-restx dependency.
Docker Image
You can now pull a pre-built docker image from the packages of this repository
docker pull ghcr.io/banesullivan/localtileserver/localtileserver:latest
To run:
docker run --rm -it -p 8000:8000 ghcr.io/banesullivan/localtileserver/localtileserver
If you want to serve/visualize tiles from files on your local system, simply mount the directory:
docker run --rm -it -p 8000:8000 -v /path/to/mount/:/data ghcr.io/banesullivan/localtileserver/localtileserver
Then be sure to put the ?filename=/data/... in the URL params
Published by banesullivan almost 3 years ago
This release adds support for three new features:
- Choose which bands to use for RGB channels when tile serving
- Generate thumbnails with the same styling parameters as tile serving
- Use any Matplotlib colormap as a
palettechoice
Example
There is a new example in the README to demonstrate RGB channel selection:
from localtileserver import get_leaflet_tile_layer, TileClient
from ipyleaflet import Map, ScaleControl, FullScreenControl, SplitMapControl

# First, create a tile server from local raster file
tile_client = TileClient('landsat.tif')

# Create 2 tile layers from same raster viewing different bands
l = get_leaflet_tile_layer(tile_client, band=[7, 5, 4])
r = get_leaflet_tile_layer(tile_client, band=[5, 3, 2])

# Make the ipyleaflet map
m = Map(center=tile_client.center(), zoom=12)
control = SplitMapControl(left_layer=l, right_layer=r)
m.add_control(control)
m.add_control(ScaleControl(position='bottomleft'))
m.add_control(FullScreenControl())
m
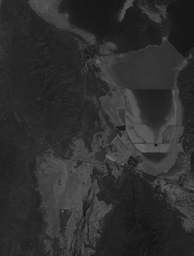
Thumbnails
and you can also generate styled thumbnails with
tile_client.thumbnail(band=[5, 3, 2], output_path='thumbnail_styled.png')
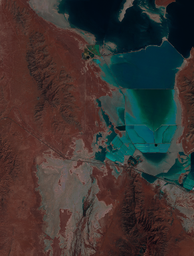
as opposed to the default channels:
tile_client.thumbnail(output_path='thumbnail_default.png')
Matplotlib Colormaps
and you can plot any single band with a matplotlib colormap by:
l = get_leaflet_tile_layer(tile_client, band=7, palette='rainbow')


m = Map(center=tile_client.center(), zoom=10)
m.add_layer(l)
m
Published by banesullivan almost 3 years ago
This adds support for serving tiles from remote raster files through GDAL's Virtual Storage Interface. Simply pass your http<s>:// or s3:// URL to the TileClient. This will work quite well for pre-tiled Cloud Optimized GeoTiffs, but I do not recommend doing this with non-tiled raster formats.
Further, this release contains a few internal changes that dramatically improve the performance of the underlying tile server. Users can control whether the server is run in a multi-threaded or multi-process manner.
from localtileserver import get_folium_tile_layer
from localtileserver import TileClient
from folium import Map

# This is a ~3GiB image
url = 'https://opendata.digitalglobe.com/events/california-fire-2020/pre-event/2018-02-16/pine-gulch-fire20/1030010076004E00.tif'

# First, create a tile server from local raster file
tile_client = TileClient(url)

# Create folium tile layer from that server
t = get_folium_tile_layer(tile_client)

m = Map(location=tile_client.center())
m.add_child(t)
m
Published by banesullivan almost 3 years ago
Now you can easily create tile layers for viewing with Folium!
from localtileserver import get_folium_tile_layer
from localtileserver import TileClient
from folium import Map

# First, create a tile server from local raster file
tile_client = TileClient('~/Desktop/TC_NG_SFBay_US_Geo.tif')

# Create folium tile layer from that server
t = get_folium_tile_layer(tile_client)

m = Map(location=tile_client.center())
m.add_child(t)
m
Published by banesullivan almost 3 years ago
I decided to rename the package to localtileserver to simplify installation and have a name consistent with the scope of package.
Published by banesullivan almost 3 years ago
Now included are some prebaked UI controls for ipyleaflet that let you easily extract ROIs. Take a look at the example in the README.
Published by banesullivan almost 3 years ago
The default viewer in the included web app now uses CesiumJS!

