ExplainableAI.jl
Explainable AI in Julia.
MIT License
| Documentation |
|
| Build Status |
|
| Testing |
|
| Code Style |
|
| Citation |
Explainable AI in Julia.
This package implements interpretability methods for black-box classifiers, with an emphasis on local explanations and attribution maps in input space. The only requirement for the model is that it is differentiable[^1]. It is similar to Captum and Zennit for PyTorch and iNNvestigate for Keras models.
[^1]: The automatic differentiation backend can be selected using ADTypes.jl.
Installation
This package supports Julia ≥1.10. To install it, open the Julia REPL and run
julia> ]add ExplainableAI
Example
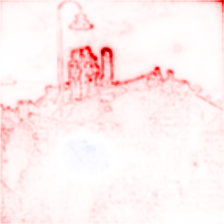
Let's explain why an image of a castle is classified as such by a vision model:
using ExplainableAI
using VisionHeatmaps         # visualization of explanations as heatmaps
using Zygote                 # load autodiff backend for gradient-based methods
using Flux, Metalhead        # pre-trained vision models in Flux
using DataAugmentation       # input preprocessing
using HTTP, FileIO, ImageIO  # load image from URL
using ImageInTerminal        # show heatmap in terminal

# Load & prepare model
model = VGG(16, pretrain=true)

# Load input
url = HTTP.URI("https://raw.githubusercontent.com/Julia-XAI/ExplainableAI.jl/gh-pages/assets/heatmaps/castle.jpg")
img = load(url)

# Preprocess input
mean = (0.485f0, 0.456f0, 0.406f0)
std  = (0.229f0, 0.224f0, 0.225f0)
tfm = CenterResizeCrop((224, 224)) |> ImageToTensor() |> Normalize(mean, std)
input = apply(tfm, Image(img))               # apply DataAugmentation transform
input = reshape(input.data, 224, 224, 3, :)  # unpack data and add batch dimension

# Run XAI method
analyzer = SmoothGrad(model)
expl = analyze(input, analyzer)  # or: expl = analyzer(input)
heatmap(expl)                    # show heatmap using VisionHeatmaps.jl
By default, explanations are computed for the class with the highest activation. We can also compute explanations for a specific class, e.g. the one at output index 5:
analyze(input, analyzer, 5)  # for explanation
heatmap(input, analyzer, 5)  # for heatmap
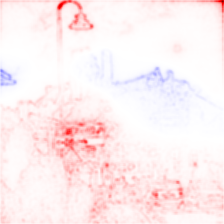
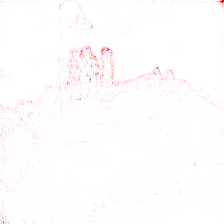
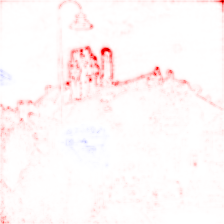
| Analyzer | Heatmap for class "castle" | Heatmap for class "street sign" |
|---|---|---|
InputTimesGradient |
 |
 |
Gradient |
 |
 |
SmoothGrad |
 |
 |
IntegratedGradients |
 |
 |
[!TIP] The heatmaps shown above were created using a VGG-16 vision model from Metalhead.jl that was pre-trained on the ImageNet dataset.
Since ExplainableAI.jl can be used outside of Deep Learning models and Flux.jl, we have omitted specific models and inputs from the code snippet above. The full code used to generate the heatmaps can be found here.
Depending on the method, the applied heatmapping defaults differ:
sensitivity-based methods (e.g. Gradient) default to a grayscale color scheme,
whereas attribution-based methods (e.g. InputTimesGradient) default to a red-white-blue color scheme.
Red color indicates regions of positive relevance towards the selected class,
whereas regions in blue are of negative relevance.
More information on heatmapping presets can be found in the Julia-XAI documentation.
[!WARNING] ExplainableAI.jl used to contain Layer-wise Relevance Propagation (LRP). Since version
v0.7.0, LRP is now available as part of a separate package in the Julia-XAI ecosystem, called RelevancePropagation.jl.
Analyzer Heatmap for class "castle" Heatmap for class "street sign" LRPwithEpsilonPluscompositeLRPwithEpsilonPlusFlatcompositeLRPwithEpsilonAlpha2Beta1compositeLRPwithEpsilonAlpha2Beta1FlatcompositeLRPwithEpsilonGammaBoxcompositeLRPwithZeroRule(discouraged)


Video Demonstration
Check out our talk at JuliaCon 2022 for a demonstration of the package.
Methods
Currently, the following analyzers are implemented:
GradientInputTimesGradientSmoothGradIntegratedGradientsGradCAM
One of the design goals of the Julia-XAI ecosystem is extensibility. To implement an XAI method, take a look at the common interface defined in XAIBase.jl.
Roadmap
In the future, we would like to include:
- PatternNet
- DeepLift
- LIME
- Shapley values via ShapML.jl
Contributions are welcome!
Acknowledgements
Adrian Hill acknowledges support by the Federal Ministry of Education and Research (BMBF) for the Berlin Institute for the Foundations of Learning and Data (BIFOLD) (01IS18037A).