
netdata
The open-source observability platform everyone needs!
GPL-3.0 License
Bot releases are visible (Hide)
Published by netdatabot over 1 year ago
- Netdata Growth
-
Release Highlights
-
Dashboard Sections' Summary Tiles
Added summary tiles to most sections of the fully-automated dashboards, to provide an instant view of the most important metrics for each section. -
Silencing of Cloud Alert Notifications
Maintenance window coming up? Active issue being checked? Use the Alert notification silencing engine to mute your notifications. -
Machine Learning - Extended Training to 24 Hours
Netdata now trains multiple models per metric, to learn the behavior of each metric for the last 24 hours. Trained models are persisted on disk and are loaded back on Netdata restart. -
Rewritten SSL Support for the Agent
Netdata Agent now features a new SSL layer that allows it to reliably use SSL on all its features, including the API and Streaming.
-
Dashboard Sections' Summary Tiles
- Alerts and Notifications
- Visualizations / Charts and Dashboards
- Preliminary steps to split native packages
- Acknowledgements
- Contributions
- Deprecation notice
- Cloud recommended version
- Release meetup
- Support options
- Running survey
Netdata Growth
🚀 Our community growth is increasing steadily. ❤️ Thank you! Your love and acceptance give us the energy and passion to work harder to simplify and make monitoring easier, more effective and more fun to use.
- Over 63,000 GitHub Stars ⭐
- Over 1.5 million online nodes
- Almost 94 million sessions served
- Over 600 thousand total nodes in Netdata Cloud
Wow! Netdata Cloud is about to become the biggest and most scalable monitoring infra ever created!
Let the world know you love Netdata.
Give Netdata a ⭐ on GitHub now.
Motivate us to keep pushing forward!
Unlimited Docker Hub Pulls!
To help our community use Netdata more broadly, we just signed an agreement with Docker for the purchase of Rate Limit Removal, which will remove all Docker Hub pull limits for the Netdata repos at Docker Hub. We expect this add-on to be applied to our repos in the following few days, so that you will enjoy unlimited Docker Hub pulls of Netdata Docker images for free!
Release Highlights
Dashboard Sections' Summary Tiles
Netdata Cloud dashboards have been improved to provide instant summary tiles for most of their sections. This includes system overview, disks, network interfaces, memory, mysql, postgresql, nginx, apache, and dozens more.
To accomplish this, we extended the query engine of Netdata to support multiple grouping passes, so that queries like "sum metrics by label X, and then average by node" are now possible. At the same time we made room for presenting anomaly rates on them (vertical purple bar on the right) and significantly improved the tile placement algorithm to support multi-line summary headers and precise sizing and positioning, providing a look and feel like this:
The following chart tile types have been added:
- Donut
- Gauge
- Bar
- Trendline
- Number
- Pie chart
To improve the efficiency of using these tiles, each of these tiles supports the following interactive actions:
- Clicking the title of the tile scroll the dashboard to the data source chart, where you can slice, dice and filter the data based on which the tile was created.
- Hovering the tile with your mouse pointer, the NIDL (Nodes, Instances, Dimensions, Labels) framework buttons appear, allowing you to explore and filter the data set, right on the tile.
Some examples that you can see from the Netdata Demo space:
Silencing of Cloud Alert Notifications
Although Netdata Agent alerts support silencing, centrally dispatched alert notifications from Netdata Cloud were missing that feature. Today, we release alert notifications silencing rules for Netdata Cloud!
Silencing rules are applied on any combination of the following: users, rooms, nodes, host labels, contexts (charts), alert name, alert role. For the matching alerts, silencing can optionally have a starting date and time and/or an ending date time.
With this feature you can now easily setup silencing rules, which can be set to be applied immediately or at a defined schedule, allowing you to plan for upcoming schedule maintenance windows - see some examples here.
Read more about Silencing Alert notifications on our documentation.
Machine Learning - Extended Training to 24 Hours
Netdata trains ML models for each metric, using its past data. This allows Netdata to detect anomalous behaviors in metrics, based exclusively on the recent past data of the metric itself.
Before this release Netdata was training one model of each metric, learning the behavior of each metric during the last 4 hours. In the previous release we introduced persisting these models to disk and loading them back when Netdata restarts.
In this release we change the default ML settings to support multiple models per metric, maintaining multiple trained models per metric, covering the behavior of each metric for last 24 hours. All these models are now consulted automatically in order to decide if a data collection point is anomalous or not.
This has been implemented in a way to avoid introducing additional CPU overhead on Netdata agents. So, instead of training one model for 24 hours which would introduce significant query overhead on the server, we train each metric every 3 hours using the last 6 hours of data, and we keep 9 models per metric. The most recent model is consulted first during anomaly detection. Additional models are consulted as long as the previous ones predict an anomaly. So only when all 9 models agree that a data collection is anomalous, we mark the collected sample as anomalous in the database.
The impact of these changes is more accurate anomaly detection out of the box, with much fewer false positives.
You can read more about it in this deck presented during a recent office hours (office hours recording).
Rewritten SSL Support for the Agent
The SSL support at the Netdata Agent has been completely rewritten. The new code now reliably support SSL connections for both the Netdata internal web server and streaming. It is also easier to understand, troubleshoot and expand. At the same time performance has been improved by removing redundant checks.
During this process a long-standing bug on streaming connection timeouts has been identified and fixed, making streaming reliable and robust overall.
Alerts and Notifications
Mattermost notifications for Business Plan users
To keep building up on our set of existing alert notification methods we added Mattermost as another notification integration option on Netdata Cloud.
As part of our commitment to expanding our set of alert notification methods, Mattermost provides another reliable way to deliver alerts to your team, ensuring the continuity and reliability of your services.
Business Plan users can now configure Netdata Cloud to send alert notifications to their team on Mattermost.
Visualizations / Charts and Dashboards
Netdata Functions
On top of the work done on release v1.38, where we introduced real-time functions that enable you to trigger specific routines to be executed by a given Agent on demand. Our initial function provided detailed information on currently running processes on the node, effectively replacing top and iotop.
We have now added the capability to group your results by specific attributes. For example, on the Processes function you are now able to group the results by: Category, Cmd or User.
With this capability you can now get a consolidated view of your reported statistics over any of these attributes.
External plugin integration
The agent core has been improved when it comes to integration with external plugins. Under certain conditions, a failed plugin would not be correctly acknowledged by the agent resulting in a defunc (i.e. zombie) plugin process. This is now fixed.
Preliminary steps to split native packages
Starting with this release, our official DEB/RPM packages have been split so that each external data collection
plugin is in its own package instead of having everything bundled into a single package. We have previously had
our CUPS and FreeIPMI collectors split out like this, but this change extends that to almost all of our external
data collectors. This is the first step towards making these external collectors optional on installs that use
our native packages, which will in turn allow users to avoid installing things they don’t actually need.
Short-term, these external collectors are listed as required dependencies to ensure that updates work correctly. At
some point in the future almost all of them will be changed to be optional dependencies so that users can pick
and choose which ones they want installed.
This change also includes a large number of fixes for minor issues in our native packages, including better handling
of user accounts and file permissions and more prevalent usage of file capabilities to improve the security of
our native packages.
Acknowledgements
We would like to thank our dedicated, talented contributors that make up this amazing community. The time and expertise that you volunteer are essential to our success. We thank you and look forward to continuing to grow together to build a remarkable product.
- @n0099 for fixing typos in the documentation.
- @mochaaP for fixing cross-compiling issues.
- @jmphilippe for making control address configurable in python.d/tor.
- @TougeAI for documenting the "age" configuration option in python.d/smartd_log.
- @mochaaP for adding support of python-oracledb to python.d/oracledb.
Contributions
Collectors
Improvements
- Add parent_table label to table/index metrics (go.d/postgres) (#1199, @ilyam8)
- Make tables and indexes limit configurable (go.d/postgres) (#1200, @ilyam8)
- Add Hyper-V metrics (go.d/windows) (#1164, @thiagoftsm)
- Add "maps per core" config option (ebpf.plugin) (#14691, @thiagoftsm)
- Add plugin that collect metrics from /sys/fs/debugfs (debugfs.plugin) (#15017, @thiagoftsm)
- Add support of python-oracledb (python.d/oracledb) (#15074, @EricAndrechek)
- Make control address configurable (python.d/tor) (#15041, @jmphilippe)
- Make connection protocol configurable (python.d/oracledb) (#15104, @ilyam8)
- Add availability status chart and alarm (freeipmi.plugin) (#15151, @ilyam8)
- Improve error messages when legacy code is not installed (ebpf.plugin) (#15146, @thiagoftsm)
Bug fixes
- Fix handling of newlines in HELP (go.d/prometheus) (#1196, @ilyam8)
- Fix collection of bind mounts (diskspace.plugin) (#14831, @MrZammler)
- Fix collection of zero metrics if Zswap is disabled (debugfs.plugin) (#15054, @ilyam8)
Other
- Document the "age" configuration option (python.d/smartd_log) (#15171, @TougeAI)
- Send EXIT before exiting in (freeipmi.plugin, debugfs.plugin) (#15140, @ilyam8)
Documentation
- Add Mattermost cloud integration docs (#15141, @car12o)
- Update Events and Silencing Rules docs (#15134, @hugovalente-pm)
- Fix a typo in simple patterns readme (#15135, @n0099)
- Add netdata demo rooms to the list of demo urls (#15120, @andrewm4894)
- Add initial draft for the silencing docs (#15112, @hugovalente-pm)
- Create category overview pages for Learn restructure (#15091, @Ancairon)
- Mention waive off of space subscription price (#15082, @hugovalente-pm)
- Update Security doc (#15072, @tkatsoulas)
- Update netdata-security.md (#15068, @cakrit)
- Fix wording in interact with charts doc (#15040, @Ancairon)
- Fix wording in the database readme (#15034, @Ancairon)
- Update troubleshooting-agent-with-cloud-connection.md (#15029, @cakrit)
- Update the billing docs for the flow (#15014, @hugovalente-pm)
- Update chart documentation (#15010, @Ancairon)
Packaging / Installation
- Fix package conflicts policy on deb based packages (#15170, @tkatsoulas)
- Fix user and group handling in DEB packages (#15166, @Ferroin)
- Change mandatory packages for RPMs (#15165, @tkatsoulas)
- Restrict ebpf dep in DEB package to amd64 only (#15161, @Ferroin)
- Make plugin packages hard dependencies (#15160, @Ferroin)
- Update libbpf to v1.2.0 (#15038, @thiagoftsm)
- Provide necessary permission for the kickstart to run the netdata-updater script (#15132, @tkatsoulas)
- Fix bundling of eBPF legacy code for DEB packages (#15127, @Ferroin)
- Fix package versioning issues (#15125, @Ferroin)
- Fix handling of eBPF plugin for DEB packages (#15117, @Ferroin)
- Improve some of the error messages in the kickstart script (#15061, @Ferroin)
- Split plugins to individual packages for DEB/RPM packaging (#13927, @Ferroin)
- Update agent telemetry url to be cloud function instead of posthog (#15085, @andrewm4894)
- Remove Fedora 36 from CI and platform support. (#14938, @Ferroin)
- Fix a fatal in the claiming script when the main action is not claiming (#15039, @ilyam8)
- Remove old logic for handling of legacy stock config files (#14829, @Ferroin)
- Make zlib compulsory dep (#14928, @underhood)
- Replace JudyLTablesGen with generated files (#14984, @mochaaP)
- Update SQLITE to version 3.41.2 (#15031, @stelfrag)
Streaming
Health
- Fix cockroachdb alarms (#15095, @ilyam8)
- Use chart labels to filter alarms (#14982, @MrZammler)
- Remove "families" from alarm configs (#15086, @ilyam8)
Exporting
- Add chart labels to Prometheus exporter (#15099, @thiagoftsm)
- Fix out-of-order labels in Prometheus exporter (#15094, @thiagoftsm)
- Fix out-of-order labels in Prometheus remote write exporter (#15097, @thiagoftsm)
ML
- Update ML defaults to 24h (#15093, @andrewm4894)
Other Notable Changes
Improvements
- Reduce netdatacli size (#15024, @stelfrag)
- Make percentage-of-group aggregatable at cloud (#15126, @ktsaou)
- Add percentage calculation on grouped queries to /api/v2/data (#15100, @ktsaou)
- Add status information and streaming stats to /api/v2/nodes (#15162, @ktsaou)
Bug fixes
- Fix the units when returning percentage of a group (#15105, @ktsaou)
- Fix uninitialized array vh in percentage-of-group (#15106, @ktsaou)
- Fix not respecting maximum message size limit of MQTT server (#15009, @underhood)
- Fix not freeing context when establishing an ACLK connection (#15073, @stelfrag)
- Fix sanitizing square brackets in label value (#15131, @ilyam8)
- Fix crash when UUID is NULL in SQLite (#15147, @stelfrag)
Code organization
- Add initial minimal h2o webserver integration (#14585, @underhood)
- Release buffer in case of error -- CID 385075 (#15090, @stelfrag)
- Improve cleanup of health log table (#15045, @MrZammler)
- Simplify loop in alert checkpoint (#15065, @MrZammler)
- Only queue an alert to the cloud when it's inserted (#15110, @MrZammler)
- Generate, store and transmit a unique alert event_hash_id (#15111, @MrZammler)
- Fix syntax in config.ac (#15139, @underhood)
- Add library to encode/decode Gorilla compressed buffers. (#15128, @vkalintiris)
- Fix coverity issues (#15169, @stelfrag)
- Fix CID 385073 -- Uninitialized scalar variable (#15163, @stelfrag)
- Fix CodeQL warning (#15062, @stelfrag)
Deprecation notice
The following items will be removed in our next minor release (v1.41.0):
Patch releases (if any) will not be affected.
| Component | Type | Will be replaced by |
|---|---|---|
| python.d/nvidia_smi | collector | go.d/nvidia_smi |
family attribute |
alert configuration and Health API | chart labels attribute (more details on netdata#15030) |
Cloud recommended version
When using Netdata Cloud, the required agent version to take most benefits from the latest features is one version before the last stable.
On this release this will become v1.39.1 and you'll be notified and guided to take action on the UI if you are running agents on lower versions.
Check here for details on how to Update Netdata agents.
Netdata Release Meetup
Join the Netdata team on the 19th of June at 16:00 UTC for the Netdata Release Meetup.
Together we’ll cover:
- Release Highlights.
- Acknowledgements.
- Q&A with the community.
RSVP now - we look forward to meeting you.
Support options
As we grow, we stay committed to providing the best support ever seen from an open-source solution. Should you encounter an issue with any of the changes made in this release or any feature in the Netdata Agent, feel free to contact us through one of the following channels:
- Netdata Learn: Find documentation, guides, and reference material for monitoring and troubleshooting your systems with Netdata.
- GitHub Issues: Make use of the Netdata repository to report bugs or open a new feature request.
- GitHub Discussions: Join the conversation around the Netdata development process and be a part of it.
- Community Forums: Visit the Community Forums and contribute to the collaborative knowledge base.
- Discord Server: Jump into the Netdata Discord and hang out with like-minded sysadmins, DevOps, SREs, and other troubleshooters. More than 1400 engineers are already using it!
Running survey
Helps us make Netdata even greater! We are trying to gather valuable information that is key for us to better position Netdata and ensure we keep bringing more value to you.
We would appreciate if you could take some time to answer this short survey (4 questions only).
Published by netdatabot over 1 year ago
This patch release provides the following bug fixes:
-
We noticed that claiming and enabling auto-updates have been failing due to incorrect permissions when
kickstart.shwas doing a static installation. The issue has affected all static installations, including the one done from the Windows MSI installer. The permissions have now been corrected. -
The recipient lists of agent alert notifications are configurable via the
health_alarm_notify.conffile. A stock file with default configurations can be modified usingedit-config. @jamgregory noticed that the default settings in that file can make changing role recipients confusing. Unless the edited configuration file included every setting of the original stock file, the resulting behavior was unintuitive. @jamgregory kindly added a PR to fix the handling of custom role recipient configurations. -
A bug in our collection and reporting of Infiniband bandwidth was discovered and fixed.
-
We noticed memory buffer overflows under some very specific conditions. We adjusted the relevant buffers and the calls to
strncpyzto prevent such overflows. -
A memory leak in certain circumstances was found in the ACLK code. We fixed the the incorrect data handling that caused it.
-
An unrelated memory leak was discovered in the ACLK code and has also been fixed.
-
Exposing the anomaly rate right on top of each chart in Netdata Cloud surfaced an issue of bad ML models on some very noisy metrics. We addressed the issue by suppressing the indications that these noisy metrics would produce. This change gives the ML model a chance to improve, based on additional collected data.
-
Finally, we improved the handling of errors during ML transactions, so that transactions are properly rolled back, instead of failing in the middle.
Support options
As we grow, we stay committed to providing the best support ever seen from an open-source solution. Should you encounter
an issue with any of the changes made in this release or any feature in the Netdata Agent, feel free to contact us
through one of the following channels:
-
Netdata Learn: Find documentation, guides, and reference material for monitoring and
troubleshooting your systems with Netdata. -
GitHub Issues: Make use of the Netdata repository to report bugs or open
a new feature request. -
GitHub Discussions: Join the conversation around the Netdata
development process and be a part of it. -
Community Forums: Visit the Community Forums and contribute to the collaborative
knowledge base. -
Discord: Jump into the Netdata Discord and hangout with like-minded sysadmins,
DevOps, SREs and other troubleshooters. More than 1300 engineers are already using it!
Published by netdatabot over 1 year ago
- Netdata open-source growth
-
Release highlights
-
Netdata Charts v3.0
A new era for monitoring charts. Powerful, fast, easy to use. Instantly understand the dataset behind any chart. Slice, dice, filter and pivot the data in any way possible! -
Windows support
Windows hosts are now first-class citizens. You can now enjoy out-of-the-box monitoring of over 200 metrics from your Windows systems and the services that run on them. -
Virtual nodes and custom labels
You now have access to more monitoring superpowers for managing medium to large infrastructures. With custom labels and virtual hosts, you can easily organize your infrastructure and ensure that troubleshooting is more efficient. -
Major upcoming changes
Separate packages for data collection plugins, mandatoryzlib, no upgrades of existing installs from versions prior to v1.11. - Bar charts for functions
-
Opsgenie notifications for Business Plan users
Business plan users can now seamlessly integrate Netdata with their Atlassian Opsgenie alerting and on call management system.
-
Netdata Charts v3.0
-
Data Collection
- Containers and VMs CGROUPS
- Docker
- Kubernetes
- Kernel traces/metrics eBPF
- Disk Space Monitoring
- OS Provided Metrics proc.plugin
- PostgreSQL
- DNS Query
- HTTP endpoint check
- Elasticsearch and OpenSearch
- Dnsmasq DNS Forwarder
- Envoy
- Files and directories
- RabbitMQ
- charts.d.plugin
- Anomalies
- Generic structured data with Pandas
- Generic Prometheus collector
- Alerts and Notifications
- Visualizations / Charts and Dashboards
- Machine Learning
- Installation and Packaging
- Administration
- Documentation and Demos
- Deprecation notice
- Netdata Agent Release Meetup
- Support options
- Running survey
- Acknowledgements
Netdata open-source growth
- Over 62,000 GitHub Stars
- Over 1.5 million online nodes
- Almost 92 million sessions served
- Over 600 thousand total nodes in Netdata Cloud
Release highlights
Netdata Charts v3.0
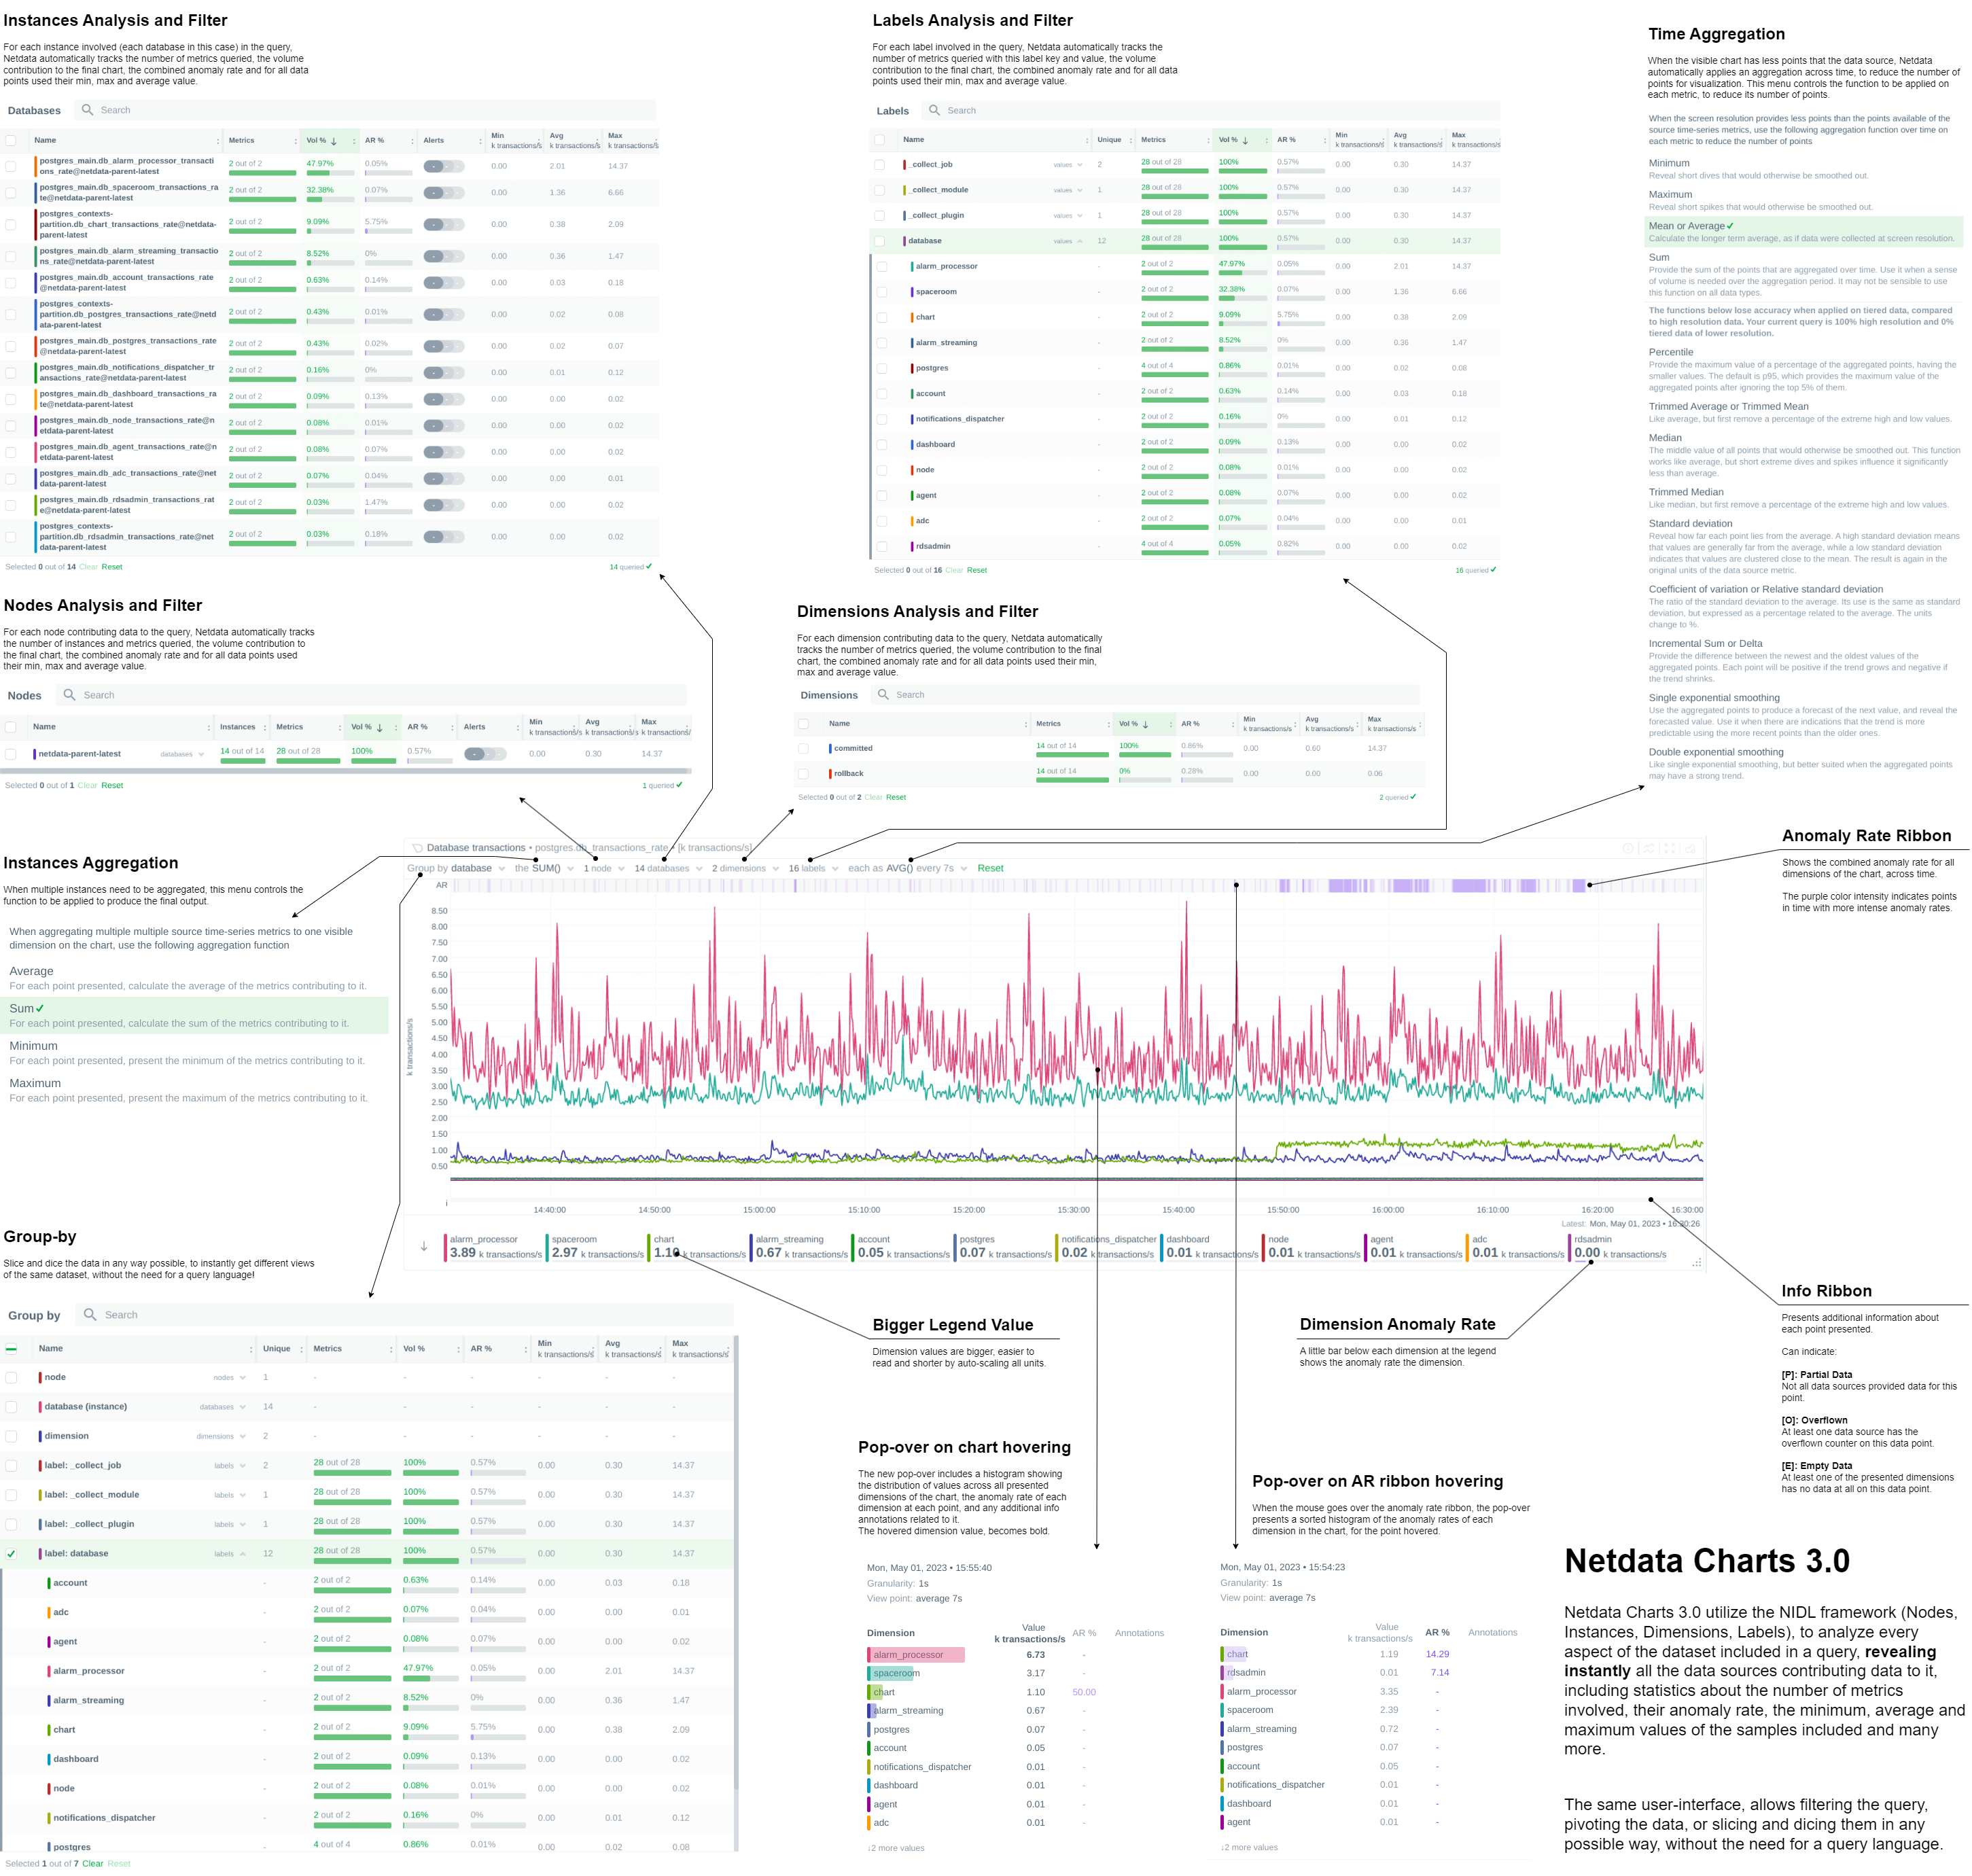
We are excited to announce Netdata Charts v3.0 and the NIDL framework. These are currently available at Netdata Cloud. At the next Netdata release, the agent dashboard will be replaced to also use the same charts.
One of the key obstacles in understanding an infrastructure and troubleshooting issues, is making sense of the data we see on charts. Most monitoring solutions assume that the users have a deep understanding of the underlying data, so during visualization they actually do nothing to help users comprehend the data easier or faster. The problem becomes even more apparent when the users troubleshooting infrastructure problems are the not the ones who developed the dashboards. In these cases all kinds of misunderstandings are possible, resulting in bad decisions and slower time to resolution.
To help users instantly understand and validate the data they see on charts, we developed the NIDL (Nodes, Instances, Dimensions, Labels) framework and we changed all the Netdata query engines, at both the agent and the cloud, to enrich the returned data with additional information. This information is then visualized on all charts.
Embedded Machine Learning for every metric
Netdata's unsupervised machine learning algorithm creates a unique model for each metric collected by your agents, using exclusively the metric's past data. We don't train ML models on a lab, or on aggregated sample data. We then use these unique models during data collection to predict the value that should be collected and check if the collected value is within the range of acceptable values based on past patterns and behavior. If the value collected is an outlier, we mark it as anomalous. This unmatched capability of real-time predictions as data is collected allows you to detect anomalies for potentially millions of metrics across your entire infrastructure within a second of occurrence.
Before this release, users had to either go to the "Anomalies" tab, or enable anomaly rate information from a button on the charts to access the anomaly rate. We found that this was not very helpful, since a lot of users were not aware of this functionality, or they were forgetting to check it. So, we decided that the best use of this information is to visualize it by default on all charts, so that users will instantly see if the AI algorithm in Netdata believes the values are not following past behavior.
In addition to the summarized tables and chart overlay, a new anomaly rate ribbon on top of each chart visualizes the combined anomaly rate of all the underlying data, highlighting areas of interest that may not be easily visible to the naked eye.
Hovering over the anomaly rate ribbon provides a histogram of the anomaly rates per dimension presented, for the specific point in time.
Anomaly rate visualization does not make Netdata slower. Anomaly rate is saved in the the Netdata database, together with metric values, and due to the smart design of Netdata, it does not even incur a disk footprint penalty.
Introducing chart annotations for comprehensive context
Chart annotations have arrived! When hovering over the chart, the overlay may display an indication in the "Info" column.
Currently, annotations are used to inform users of any data collection issues that might affect the chart. Below each chart, we added an information ribbon. This ribbon currently shows 3 states related to the points presented in the chart:
-
[P]: Partial Data
At least one of the dimensions in the chart has partial data, meaning that not all instances available contributed data to this point. This can happen when a container is stopped, or when a node is restarted. This indicator helps to gain confidence of the dataset, in situations when unusual spikes or dives appear due to infrastructure maintenance, or due to failures to part of the infrastructure. -
[O]: Overflowed
At least one of the datasources included in the chart was a counter that has overflowed exactly that point. -
[E]: Empty Data
At least one of the dimensions included in the chart has no data at all for the given points.
All these indicators are also visualized per dimension, in the pop-over that appears when hovering the chart.
New hover pop-over
Hovering over any point in the chart now reveals a more informative overlay. This includes a bar indicating the volume percentage of each time series compared to the total, the anomaly rate, and a notification if there are data collection issues (annotations from the info ribbon).
The pop-over sorts all dimensions by value, makes bold the closest dimension to the mouse and presents a histogram based on the values of the dimensions.
When hovering the anomaly ribbon, the pop-over sorts all dimensions by anomaly rate, and presents a histogram of these anomaly rates.
NIDL framework
You can now rapidly access condensed information for collected metrics, grouped by node, monitored instance, dimension, or any label key/value pair. Above all charts, there are a few drop-down menus. These drop-down menus have 2 functions:
- Provide additional information about the visualized chart, to help us understand the data we see.
- Provide filtering and grouping capabilities, altering the query on the fly, to help us get different views of the dataset.
In this release, we extended the query engines of Netdata (both at the agent and the cloud), to include comprehensive statistical data to help us understand what we see on the chart. We developed the NIDL framework to standardize this presentation across all charts.
The NIDL framework attaches the following metadata to every metric we collect:
- The Node each metric comes from
- The Instance each metric belongs to. An instance can be container, a disk, a network interface, a database server, a table in a given data server, etc. The instance describes which exactly component of our infrastructure we monitor. At the charts, we replaced the word "instance" with the proper name of that instance. So, when the instance is a disk, we see "disks". When it is a container, we see "containers", etc.
- The Dimensions are the individual metrics related to an instance under a specific context.
- The Labels are all the labels that are available for each metric, that many or may not be related to the node or the instance of them metric.
Since all our metrics now have these metadata, we are use them at query time, to provide for each of them the following consolidated data for the visible time frame:
- The volume contribution of each of them into the final query. So even if a query comes from 1000 nodes, we can instantly see the contribution of each node in the result. The same for instances, dimensions and labels. Especially for labels, Netdata also provides the volume contribution of each label
key:valuepair to the final query, so that we can immediately see for all label values involved in the query how much they affected the chart. - The anomaly rate of each of them for the time-frame of the query. This is used to quickly spot which of the nodes, instances, dimensions or labels have anomalies in the requested time-frame.
- The minimum, average and maximum values of all the points used for the query. This is used to quickly spot which of the nodes, instances, dimensions or labels are responsible for a spike or a dive in the chart.
All of these drop-down menus can now be used for instantly filtering the dataset, by including or excluding specific nodes, instances, dimensions or labels. Directly from the drop-down menu, without the need to edit a query string and without any additional knowledge of the underlying data.
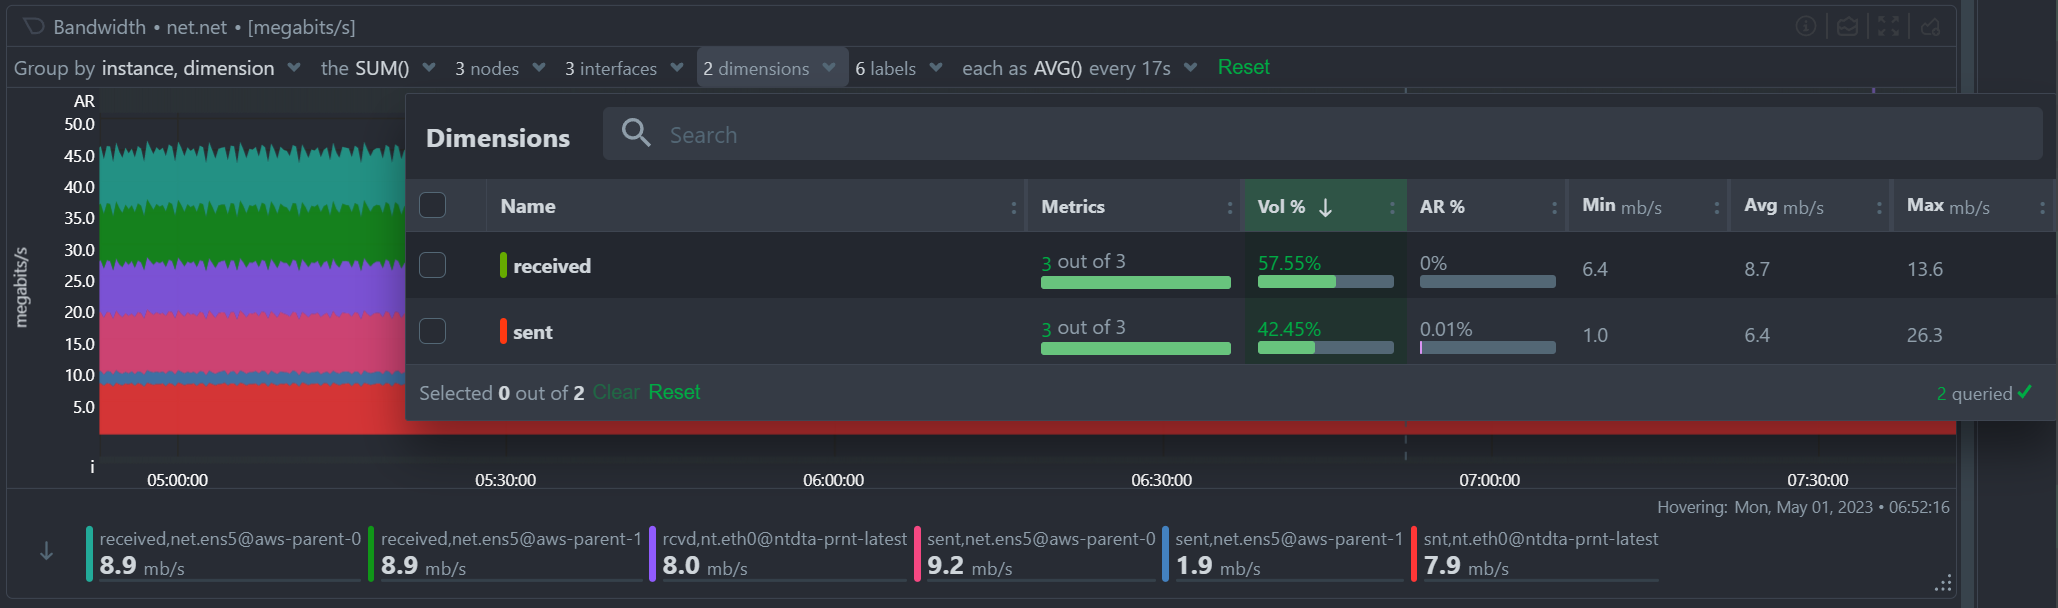
Multiple Group-by
At the same time, the new query engine of Netdata has been enhanced to support multiple group-by at once. The "Group by" drop-down menu allows selecting 1 or more groupings to be applied at once on the same dataset. Currently it supports:
- Group by Node, to summarize the data of each node, and provide one dimension on the chart for each of the nodes involved. Filtering nodes is supported at the same time, using the nodes drop-down menu.
- Group by Instance, to summarize the data of each instance and provide one dimension on the chart for each of the instances involved. Filtering instances is supported at the same time, using the instances drop-down menu.
- Group by Dimension
- Group by Label, to summarize the data for each label value. Multiple label keys can be selected at the same time.
Using this menu, you can slice and dice the data in any possible way, to quickly get different views of them, without the need to edit a query string and without any need to better understand the format of the underlying data. Netdata will do its by itself.
Windows support
We are excited to announce that our Windows monitoring capabilities have been greatly improved with the addition of over 170 new system, network, and application metrics. This includes out-of-the-box support for MS Exchange, MS SQL, IIS, Active Directory (including AD Certificate and AD Federation Services).
To try out Netdata directly on your Windows machine, our .msi installer allows for quick and easy installation with a Netdata WSL distribution. However, for production deployments, one or more Linux nodes are still required to run Netdata and store your metrics, as shown in the provided diagram.

To fully support this architecture, we have added the ability to declare each Windows host as a Netdata node. You can learn more about this feature in the virtual nodes section.
For more information, please check out our high-level introduction to
Windows monitoring, our demo, or our Windows collector documentation.
Virtual nodes and custom labels
Netdata provides powerful tools for organizing hundreds of thousands of metrics collected every second in large infrastructures. From the automated organization into sections of related out-of-the-box aggregate charts, to concepts like spaces and war rooms that connect the metrics with the people who need to use them, scale is no problem. Easily slicing and dicing the metrics via grouping and filtering in our charts is also essential for exploration and troubleshooting, which is why we in the past we introduced host labels and default metric labels. To complete the available tool set, Netdata now offers the ability to define custom metric labels and virtual nodes. You can read how everything fits together in our documentation.
You can use custom labels to group and filter metrics in the Netdata Cloud aggregate charts. Virtual nodes work like normal Netdata Cloud nodes for the metrics you assign to them and can be added to any room.
The ability to define a virtual node is a new feature that is essential for monitoring remote Windows hosts, but has many other potential uses. For example, you may have a central monitoring node collecting data from many remote database hosts that you aren't allowed to install software on. You may also use the HTTP endpoint collector to check the availability and latency of APIs on multiple remote endpoints.
Defining virtual nodes lets you substantiate those entities that have no Netdata running on them, so they can appear in Netdata Cloud, be placed in rooms, filtered and grouped easily, and have their virtual node name displayed in alerts. Learn how to configure virtual nodes for any go.d.plugin data collection job.
Major upcoming changes
Please read carefully through the following planned changes in our packaging, support of existing installs and required dependencies, as they may impact you. We are committed to providing the most up-to-date and reliable software, and we believe that the changes outlined below will help us achieve this goal more efficiently. As always, we are happy to provide any assistance needed during this transition.
Upcoming collector packaging changes
As previously discussed on our blog, we will be changing how we package our external data collection plugins in the coming weeks. This change will be reflected in nightly builds a few weeks after this release, and in stable releases starting with v1.40.0. Please note that any patch releases for v1.39.0 will not include this change.
For detailed information on this change and how it may impact you, please refer to our blog post titled Upcoming Changes to Plugins in Native Packages.
Upcoming end of support for upgrading very old installs
Beginning shortly after this release, we will no longer be providing support for upgrading existing installs from versions prior to Netdata v1.11.0. It is highly unlikely that this change will affect any existing users, as v1.11.0 was released in 2018. However, this change is important in the long-term, as it will allow us to make our installer and updater code more portable.
Upcoming mandatory dependency on zlib
In the near future, we will be making a significant change to the Netdata agent by making zlib a mandatory dependency. Although we have not treated it as a mandatory dependency in the past, a number of features that we consider core parts of the agent rely on zlib. Given that zlib is ubiquitous across almost every platform, there is little to no benefit to it being an optional dependency. As such, this change is unlikely to have a significant impact on the vast majority of our users.
The change will be implemented in nightly builds shortly after this release and in stable releases starting with v1.40.0. Please note that any patch releases for v1.39.0 will not include this change.
Bar charts for functions
In v1.38, we introduced real-time functions that enable you to trigger specific routines to be executed by a given Agent on demand. Our initial function provided detailed information on currently running processes on the node, effectively replacing top and iotop.
We have now expanded the versatility of functions by incorporating configurable bar charts above the table displaying detailed data. These charts will be a standard feature in all future functions, granting you the ability to manipulate and analyze the retrieved data as needed.
Opsgenie notifications for Business Plan users
Ensuring the reliable delivery of alert notifications is crucial for maintaining the reliability of your services. While individual Netdata agents were already able to send alert notifications to Atlassian's Opsgenie, Netdata Cloud adds centralized control and more robust retry and failure handling mechanisms to improve the reliability of the notification delivery process.
Business Plan users can now configure Netdata Cloud to send alert notifications to their Atlassian Opsgenie platform, using our centralized alert dispatching feature. This feature helps to ensure the reliable delivery of notifications, even in cases where individual agents are offline or experiencing issues.
We are committed to continually extending the capabilities of Netdata Cloud, and our focus on centralized alert dispatching is just one example of this. By adding more centralized dispatching options, we can further increase the reliability of notification delivery and help our users maintain the highest levels of service reliability possible.
Data Collection
Containers and VMs (CGROUPS)
The cgroups plugin reads information on Linux Control Groups to monitor containers, virtual machines and systemd services.
Previously, we identified individual Docker containers solely through their container ID, which may not always provide adequate information to identify potential issues with your infrastructure. However, we've made significant improvements to our system by incorporating labels containing the image and the name of each container to all the collected metrics. These features allows you to group and filter the containers in a more efficient and effective manner, enabling you to quickly pinpoint and troubleshoot any issues that may arise
We always strive to provide the most informative chart titles and descriptions. The title of all our container CPU usage charts explain that 100% utilization means 1 CPU core, which also means you can exceed 100% when you add the utilization of multiple cores. This logic is a bit foreign to Kubernetes monitoring, where mCPU is clearer. So we modified the chart title to state that 100% utilization is equivalent to 1000 mCPUs.
We place great importance on delivering the most informative chart titles and descriptions to our users. Our container CPU usage charts are no exception. We understand that the concept of 100% CPU utilization equating to 1 CPU core, and the ability to exceed 100% by adding the utilization of multiple cores may seem a bit unfamiliar to those using Kubernetes monitoring. In light of this, we have taken steps to modify our chart title by incorporating mCPU, which provides greater clarity. The title now indicates that 100% utilization equates to 1000 mCPUs in k8s. We hope this change will help you better understand and interpret our container CPU usage charts.
Docker
Netdata monitors the Docker engine to automatically generate charts for container health and state, and image size and state.
Previously, this collector only retrieved aggregate metrics for the containers managed by the Docker engine. We started a major change
in the way we collect metrics from Docker so that we can now present the health of each container separately, or grouped by the container name and image labels. Some teething issues with this change were fixed quickly with #1160.
We recently increased the client version of our collector, which started causing issues with older Docker engine servers. We resolved these issues by adding client version negotiation to our Docker collector.
Kubernetes
Monitoring Kubernetes clusters can be challenging due to the intricate nature of the infrastructure. Identifying crucial aspects to monitor necessitates considerable expertise, which Netdata provides out-of-the-box through dedicated collectors for every layer of your Kubernetes infrastructure.
One key area to keep an eye on is the overall cluster state, which we address using the Kubernetes Cluster State Collector. This collector generates automated dashboards for 37 metrics encompassing overall node and pod resource limits and allocations, as well as pod and container readiness, health, and container restarts. Initially, we displayed the rate of container restarts, as we did with numerous other events. However, restarts are infrequent occurrences in many infrastructures. Displaying the rate of sparse events can lead to suboptimal charts for troubleshooting purposes. To address this, we have modified the logic and now present the absolute count of container restarts for enhanced clarity.
Kubernetes monitoring also relies on the cgroups plugin for container and pod monitoring. To properly label k8s containers, the cgroup plugin makes calls to the k8s API server to retrieve pod metadata. In large clusters and under certain conditions (e.g. starting all the agents at once), these requests can potentially cause serious stress on the API server, or even a denial of service incident. To address this issue we have provided an alternative to querying the API server. We now allow querying the local kubelet server for the same information. However, since the Kubelet's /pods endpoint is not well documented and should probably not be relied on (see 1, 2), we still query the API server by default. To switch to querying Kubelet, you can set the child.podsMetadata.useKubelet and child.podsMetadata.kubeletUrl variables that were added to our Helm chart.
Kernel traces/metrics (eBPF)
The eBPF Collector offers numerous eBPF programs to assist you in troubleshooting and analyzing how applications interact with the Linux kernel. By utilizing tracepoints, trampoline, and kprobes, we gather a wide range of valuable data about the host that would otherwise be unattainable.
We recently addressed some significant issues with SIGABRT crashes on some systems. These crashes were caused by problems with memory allocation and deallocation functions, which resulted in unstable system behavior and prevented users from effectively monitoring their systems. To resolve these issues, we made some significant changes to our memory allocation and deallocation functions. Specifically, we replaced these functions with more reliable alternatives and began using vector allocation where possible.
We later identified issues with memory corruption, Oracle Linux ported codes and OOMKill, which were all resolved with #14869.
Finally, issues with CPU usage on EC2 instances appeared in a nightly release and were resolved with some changes that speed up the plugin clean up process and also prevent some possible SIGABRT and SIGSEGV crashes.
These changes helped to reduce the likelihood of crashes occurring and improved the overall stability and reliability of the eBPF collector.
In some environments, the collector demanded substantial memory resources. To address this, we introduced charts to monitor its memory usage and implemented initial optimizations to decrease the RAM requirements. We will continue this work in future releases, to bring you even
more eBPF observability superpowers, with minimal resource needs.
Disk Space Monitoring
The disk space plugin is designed to monitor disk space usage and inode usage for mounted disks in Linux. However, because msdos/FAT file systems don't use inodes, the plugin would often generate false positives, leading to inaccurate results. To fix this, we've disabled inode data collection for these file systems, using the exclude inode metrics on filesystems configuration option. This option has a default value of msdosfs msdos vfat overlayfs aufs* *unionfs.
OS Provided Metrics (proc.plugin)
Our proc plugin is responsible for gathering system metrics from various endpoints, including /proc and /sys folders in Linux systems. It is an essential part of our monitoring tool, providing insights into system performance.
When running the Netdata agent in a Docker container, we encountered an issue where zram memory metrics were not being displayed. To solve this, we made changes to the zram collector code, respecting the /host prefix added to the directories mounted from the host to the container. Now, our monitoring tool can collect zram memory metrics even when running in a Docker container.
We also improved the zfs storage pool monitoring code, by adding the state suspended to the list of monitored states.
Finally, we added new metrics for BTRFS commits and device errors.
PostgreSQL
Our PostgreSQL collector is a highly advanced application collector, offering 70 out-of-the-box charts and 14 alerts to help users monitor their PostgreSQL databases with ease.
We recently discovered an issue in our documentation where we were instructing users to create a netdata user, even though our data collection job was using the postgres user. To address this issue, we have now added the netdata user as an additional option to our data collection jobs. With this enhancement, users can now use either the postgres user or the newly added netdata user to collect data from their PostgreSQL databases, ensuring a more seamless and accurate monitoring experience.
Netdata automatically generates several charts for PostreSQL write-ahead logs (WAL). We recently discovered that
wal_files_count, wal_archiving_files_count and replication_slot_files_count require superuser access, so we
added a check on whether the collection job has superuser access, before
attempting to collect these WAL metrics.
Finally, we fixed a bug with the bloat size calculation that used to erroneously return zeroes for some indexes.
DNS Query
The DNS query collector is a crucial tool that ensures optimal system performance by monitoring the liveness and latency of DNS queries. This tool is simple yet essential, as it attempts to resolve any hostname you provide and creates metrics for the response time and success or failure of each request/response.
Previously, we only measured the response time for successful queries. However, we have now enhanced the DNS query collector by collecting latency data for failed queries as well. This improvement enables us to identify and troubleshoot DNS errors more effectively, which ultimately leads to improved system reliability and performance.
HTTP endpoint check
Modern endpoint monitoring should include periodic checks on all your internal and public web applications, regardless of their traffic patterns. Automated and continuous tests can proactively identify issues, allowing them to be resolved before any users are affected.
Netdata's HTTP endpoint collector is a powerful tool that enables users to monitor the response status, latency, and content of any URL provided. While the collector has always supported basic authentication via a provided username and password, we have recently introduced a new enhancement that allows for more complex authentication flows. With the addition of the ability to include a cookie in the request, users can now authenticate and monitor more advanced applications, ensuring more comprehensive and accurate monitoring capabilities.
All you need to do is to add cookie: <filename> to your data collection job and the collector will issue the request will the contents of that file.
Elasticsearch and OpenSearch
Our Elasticsearch Collector seamlessly generates visualizations for 47 metrics, drawing from 4 endpoints of the renowned search engine.
The original Elasticsearch project evolved into an open-source initiative called OpenSearch, spearheaded by Amazon. However, our collector did not automatically connect to OpenSearch instances due to their default security settings with TLS and authentication.
Although it is possible to disable security by adding plugins.security.disabled: true to /etc/opensearch/opensearch.yml, which allows the default data collection job to function, we deemed it more prudent to introduce an OpenSearch-specific data collection job. This addition explicitly enables TLS and highlights the necessity of a username and password for secure access.
Dnsmasq DNS Forwarder
Dnsmasq is a lightweight and easy-to-configure DNS forwarder that is specifically designed to offer DNS, DHCP, and TFTP services to small-scale networks. Netdata provides comprehensive monitoring of Dnsmasq by collecting metrics for both the DHCP server and DNS forwarder.
Recently, we made a minor but important improvement to the order in which the DNS forwarder cache charts are displayed. With this update, the most critical information regarding cache utilization is now presented first, providing users with more efficient access to essential data. By constantly improving and refining our monitoring capabilities, we aim to provide our users with the most accurate and useful insights into their network performance.
Envoy
Envoy is an L7 proxy and communication bus designed for large modern service oriented architectures.
Our new Envoy collector automatically generates charts for over 50 metrics.
Files and directories
The files and directories collector monitors existence, last update and size of any files or directories you specify.
The collector was not sanitizing file and directory names, causing issues with metric collection. The issue was specific to paths with
spaces in them and is now fixed.
RabbitMQ
The Netdata agent includes a RabbitMQ collector that tracks the performance of this open-source message broker. This collector queries RabbitMQ's HTTP endpoints, including overview, node, and vhosts, to provide you with detailed metrics on your RabbitMQ instance. Recently, we fixed an issue that prevented our collector from properly collecting metrics on 32-bit systems.
charts.d.plugin
The charts.d plugin is an external plugin for Netdata. It's responsible for orchestrating data collection modules written in BASH v4+ to gather and visualize metrics.
Recently, we fixed an issue with the plugin's restarts that sometimes caused the connection to Netdata to be lost. Specifically, there was a chance for charts.d processes to die at the exact same time when the Netdata binary tried to read from them using fgets. This caused Netdata to hang, as fgets never returned. To fix this issue, we added a "last will" EOF to the exit process of the plugin. This ensures that the fgets call has something to receive before the plugin exits, preventing Netdata from hanging.
With this issue resolved, the charts.d plugin can now continue to provide seamless data collection and visualization for your Netdata instance without any disruptions.
Anomalies
Our anomaly collector is a powerful tool that uses the PyOD library in Python to perform unsupervised anomaly detection on your Netdata metrics. With this collector, you can easily identify unusual patterns in your data that might indicate issues with your system or applications.
Recently, we discovered an issue with the collector's Python version check. Specifically, the check was incorrectly rejecting Python 3.10 and higher versions due to how the float() function was casting "10" to "1". This resulted in an inaccurate check that prevented some users from using the anomaly collector with the latest versions of Python.
To resolve this issue, we fixed the Python version check to work properly with Python 3.10 and above. With this fix in place, all users can now take advantage of the anomaly collector's powerful anomaly detection capabilities regardless of the version of Python they are using.
Generic structured data (Pandas)
Pandas is a de-facto standard in reading and processing most types of structured data in Python. If you have metrics appearing in a CSV, JSON, XML, HTML, or other supported format,
either locally or via some HTTP endpoint, you can easily ingest and present those metrics in Netdata, by leveraging the Pandas collector. We fixed an issue we had logging some collector errors.
Generic Prometheus collector
Our Generic Prometheus Collector gathers metrics from any Prometheus endpoint that uses the OpenMetrics exposition format.
In version 1.38, we made some significant changes to how we generate charts with labels per label set. These changes resulted in a drastic increase in the length of generated chart IDs, which posed some challenges for users with a large number of label key/value pairs. In some cases, the length of the type.id` string could easily exceed the previous limit of 200 characters, which prevented users from effectively monitoring their systems.
To resolve this issue, we took action to increase the chart ID limit from 200 to 1000 characters. This change provides you with more flexibility when it comes to labeling their charts and ensures that you can effectively monitor their systems regardless of the number of label key/value pairs you use.
Alerts and Notifications
Notifications
Improved email alert notifications
We recently made some significant improvements to our email notification templates. These changes include adding the chart context, Space name, and War Room(s) with navigation links. We also updated the way the subject is built to ensure it's consistent with our other templates.
These improvements help to provide users with more context around their alert notifications, making it easier to quickly understand the nature of the issue and take appropriate action. By including chart context, Space name, and War Room(s) information, users can more easily identify the source of the problem and coordinate a response with their team members.
Receive only notifications for unreachable nodes
We've also enhanced our personal notification level settings to include an "Unreachable only" option. This option allows you to receive only reachability notifications for nodes disconnected from Netdata cloud. Previously this capability was only available combined with "All alerts". With this enhancement, you can now further customize you notification settings to more effectively manage your alerts and reduce notification fatigue.
ntfy agent alert notifications
The Netdata agent can now send alerts to ntfy servers. ntfy (pronounced "notify") is a simple HTTP-based pub-sub notification service. It allows you to send notifications to your phone or desktop via scripts from any computer, entirely without sign-up, cost or setup. It's also open source if you want to run your own server.
You can learn how to send ntfy alert notifications from a Netdata agent in our documentation.
Enhanced Real-Time Alert Synchronization on Netdata Cloud
Cloud to manage millions of alert state transitions daily. These transitions are transmitted from each connected agent through the agent-Cloud Link (ACLK). As with any communication channel, occasional data loss is unavoidable. Therefore, swiftly detecting missing transitions and reconciling discrepancies is crucial for maintaining real-time observability, regardless of scale.
We are thrilled to introduce a significant enhancement to our alert synchronization protocol between Netdata Agents and Netdata Cloud. This upgrade ensures faster transmission of alert states and prompt resolution of any temporary inconsistencies.
In the past, whenever a state transition change occurred, a message with a sequencing number was sent from the Agent to the Cloud. This method resulted in numerous read/write operations, generating excessive load on our Alerts database in the Cloud. Furthermore, it assumed that all messages had to be processed sequentially, imposing unnecessary constraints and restricting our scaling options for message brokers.

Our revamped protocol implements a far more efficient method. Instead of relying on sequencing numbers, we now use a checksum value calculated by both the Cloud and the Agent to verify synchronization. This approach not only lessens the burden on our Alerts database but also eliminates the dependency on sequential message processing, permitting out-of-order message delivery.

The enhanced synchronization and scaling capabilities allow us to address certain edge cases where users experienced out-of-sync alerts on the Cloud. Consequently, we can now deliver a superior service to our users.
Visualizations / Charts and Dashboards
Events Feed
We're committed to continually improving our [Events Feed](https://learn.netdata.cloud/docs/troubleshooting-and-machine-learning events-feed), which we introduced in version 1.38. We've made several user experience (UX) improvements to make the Events Feed even more useful for troubleshooting purposes.
One of the key improvements we made was the addition of a bar chart showing the distribution of events over time. This chart helps users quickly identify interesting time periods to focus on during troubleshooting. By visualizing the distribution of events across time, users can more easily spot patterns or trends that may be relevant to their troubleshooting efforts.
These improvements help to make the Events Feed an even more valuable tool, helping you troubleshoot issues more quickly and effectively. We will continue to explore ways to enhance the Events Feed and other features of our monitoring tool to provide the best possible user experience.

Machine Learning
As part of our Machine Learning Roadmap we have been working to persist trained models to the db so that the models used in Netdata's native anomaly detection capabilities will not be lost on restarts and instead be persisted to the database. This is an important step on the way to extending the ML defaults to train on the last 24 hours by default in the near future (as discussed more in this blog post). This will help improve anomaly detection performance, reducing false positives and making anomaly rates more robust to system and netdata restarts where previously models would need to be fully re-trained.
This is an area of quite active development right now and there are still a few more pieces of work to be done in coming releases. If interested you can follow along with any area/ML issues in netdata/netdata-cloud or netdata/netdata and check out active PR's here.
Installation and Packaging
Improved Linux compatibility
We have updated the bundled version of makeself used to create static builds, which was almost six years out of date, to sync it with the latest upstream release. This update should significantly improve compatibility on more exotic Linux systems.
We have also updated the metadata embedded in the archive to better reflect the current state of the project. This ensures that the project is up to date and accurately represented, providing users with the most relevant and useful information.
You can find more details about these updates in our Github repository.
Administration
New way to retrieve netdata.conf
Previously, the only way to get a default netdata.conf file was to start the agent and query the /netdata.conf API endpoint. This worked well enough for checking the effective configuration of a running agent, but it also meant that edit-config netdata.conf didn't work as users expect, if there is no netdata.conf file. It also meant that you couldn't check the effective configuration if you have the web server disabled.
We have now added the netdatacli dumpconfig command, which outputs the current
netdata.conf, exactly like the web API endpoint does. In the future we will look into making the edit-config command a bit smarter,
so that it can provide the option to automatically retrieve the live netdata.conf.
Documentation and Demos
We're excited to announce the completion of a radical overhaul of our documentation site, available at learn.netdata.cloud. Our new site features a much clearer organization of content, a streamlined publishing process, and a powerful Google search bar that searches all available resources for articles matching your queries.
We've restructured and improved dozens of articles, updating or eliminating obsolete content and deduplicating similar or identical content. These changes help to ensure that our documentation remains up-to-date and easy to navigate.
Even seasoned Netdata power users should take a look at our new Deployment in Production section, which includes features and suggestions that you may have missed in the past.
We're committed to maintaining the highest standards for our documentation and invite our users to assist us in this effort. The "Edit this page" button, available on all published articles, allows you to suggest updates or improvements by directly editing the source file.
We hope that our new documentation site helps you more effectively use and understand our monitoring tool, and we'll continue to make improvements and updates based on your feedback.
Deprecation notice
The following items will be removed in our next minor release (v1.40.0):
Patch releases (if any) will not be affected.
| Component | Type | Will be replaced by |
|---|---|---|
| python.d/nvidia_smi | collector | go.d/nvidia_smi |
Deprecated in this release
In accordance with our previous deprecation notice, the following items have been removed in this release:
| Component | Type | Replaced by |
|---|---|---|
| python.d/ntpd | collector | go.d/ntpd |
| python.d/proxysql | collector | go.d/proxysql |
| python.d/rabbitmq | collector | go.d/rabbitmq |
Netdata Release Meetup
Join the Netdata team on the 9th of May, at 16:00 UTC for the Netdata Release Meetup.
Together we’ll cover:
- Release Highlights.
- Acknowledgements.
- Q&A with the community.
RSVP now - we look forward to meeting you.
Support options
As we grow, we stay committed to providing the best support ever seen from an open-source solution. Should you encounter an issue with any of the changes made in this release or any feature in the Netdata Agent, feel free to contact us through one of the following channels:
- Netdata Learn: Find documentation, guides, and reference material for monitoring and troubleshooting your systems with Netdata.
- GitHub Issues: Make use of the Netdata repository to report bugs or open a new feature request.
- GitHub Discussions: Join the conversation around the Netdata development process and be a part of it.
- Community Forums: Visit the Community Forums and contribute to the collaborative knowledge base.
- Discord Server: Jump into the Netdata Discord and hang out with like-minded sysadmins, DevOps, SREs, and other troubleshooters. More than 1400 engineers are already using it!
Running survey
Helps us make Netdata even greater! We are trying to gather valuable information that is key for us to better position Netdata and ensure we keep bringing more value to you.
We would appreciate if you could take some time to answer this short survey (4 questions only).
Acknowledgements
We would like to thank our dedicated, talented contributors that make up this amazing community. The time and expertise that you volunteer are essential to our success. We thank you and look forward to continuing to grow together to build a remarkable product.
- @farax4de for fixing an exception in the CEPH collector.
- @ghanapunq for adding ethtool to the list of third-party collectors.
- @intelfx for fixing the accounting of Btrfs unallocated space in the proc plugin.
- @k0ste for fixing an issue with x86_64 RPM builds with eBPF.
- @slavox for fixing a typo in the documentation.
-
@vobruba-martin for fixing the
--release-channeland--nightly-channeloptions inkickstart.sh. - @bompus for fixing an issue preventing non-interactive installs of our static builds from fully automatic.
- @D34DC3N73R for adding Docker instructions to enable NVIDIA GPUs
Published by netdatabot over 1 year ago
The first patch release for v1.38 updates the version of OpenSSL included in our static builds
and Docker images to v1.1.1t, to resolve a few moderate security vulnerabilities in v1.1.1n.
The patch also includes the following minor bug fixes:
-
We fixed the handling of dimensions with no data in a specific timeframe.
When the metrics registry recorded a dimension as present in a specific timeframe, but the dimension did not have any data for that timeframe,
the query engine would return random data that happened to be in memory. - We fixed occasional crashes during shutdown when not using eBPF.
- We fixed the systemd service file handling on systems using a systemd version older than v235.
- We fixed build failures on FreeBSD 14 release candidates, FreeBSD < 13.1, and environments with Linux kernel version < 5.11.
Support options
As we grow, we stay committed to providing the best support ever seen from an open-source solution. Should you encounter
an issue with any of the changes made in this release or any feature in the Netdata Agent, feel free to contact us
through one of the following channels:
-
Netdata Learn: Find documentation, guides, and reference material for monitoring and
troubleshooting your systems with Netdata. -
GitHub Issues: Make use of the Netdata repository to report bugs or open
a new feature request. -
GitHub Discussions: Join the conversation around the Netdata
development process and be a part of it. -
Community Forums: Visit the Community Forums and contribute to the collaborative
knowledge base. -
Discord: Jump into the Netdata Discord and hangout with like-minded sysadmins,
DevOps, SREs and other troubleshooters. More than 1300 engineers are already using it!
Published by netdatabot over 1 year ago
-
-
DBENGINE v2
The new open-source database engine for Netdata Agents, offering huge performance, scalability and stability improvements, with a fraction of memory footprint! -
FUNCTION: Processes
Netdata beyond metrics! We added the ability for runtime functions, that can be implemented by any data collection plugin, to offer unlimited visibility to anything, even not-metrics, that can be valuable while troubleshooting. -
Events Feed
Centralized view of Space and Infrastructure level events about topology changes and alerts. -
NOTIFICATIONS: Slack, PagerDuty, Discord, Webhooks
Netdata Cloud now supports Slack, PagerDuty, Discord, Webhooks. -
Role-based access model
Netdata Cloud supports more roles, offering finer control over access to infrastructure.
-
-
Integrations
New and improved plugins for data collection, alert notifications, and data exporters. -
Health Monitoring and Alerts Notification Engine
Changes to the Netdata Health Monitoring and Notifications engine.
❗We are keeping our codebase healthy by removing features that are end-of-life. Read the deprecation notice to check if you are affected.
Netdata open-source growth
- Almost 62,000 GitHub Stars
- Over four million monitored servers
- Almost 88 million sessions served
- Over 600 thousand total nodes in Netdata Cloud
Release highlights
Dramatic performance and stability improvements, with a smaller agent footprint
We completely reworked our custom-made, time series database (dbengine), resulting in stunning improvements to performance, scalability, and stability, while at the same time significantly reducing the agent memory requirements.
On production-grade hardware (e.g. 48 threads, 32GB ram) Netdata Agent Parents can easily collect 2 million points/second while servicing data queries for 10 million points / second, and running ML training and Health querying 1 million points / second each!
For standalone installations, the 64bit version of Netdata runs stable at about 150MB RAM (Reside Set Size + SHARED), with everything enabled (the 32bit version at about 80MB RAM, again with everything enabled).

Key highlights of the new dbengine
Disk based indexing
We introduced a new journal file format (*.jnfv2) that is way faster to initialize during loading. This file is used as a disk-based index for all metric data available on disk (metrics retention), reducing the memory requirements of dbengine by about 80%.
New caching
3 new caches (main cache, open journal cache, extent cache) have been added to speed up queries and control the memory footprint of dbengine.
These caches combined, offer excellent caching even for the most demanding queries. Cache hit ratio now rarely falls bellow 50%, while for the most common use cases, it is constantly above 90%.
The 3 caches support memory ballooning and autoconfigure themselves, so they don't require any user configuration in netdata.conf.
At the same time, their memory footprint is predictable: twice the memory of the currently collected metrics, across all tiers. The exact equation is:
METRICS x 4KB x (TIERS - 1) x 2 + 32MB
Where:
-
METRICS x 4KB x TIERSis the size of the concurrently collected metrics. -
4KBis the page size for each metric. -
TIERSis whatever configured for[db].storage tiersinnetdata.conf; use(TIERS - 1)when using 3 tiers or more (3 is the default). -
x 2 + 32MBis the commitment of the new dbengine.
The new combination of caches makes Netdata memory footprint independent of retention! The amount of metric data on disk, does not any longer affect the memory footprint of Netdata, it can be just a few MB, or even hundreds of GB!
The caches try to keep the memory footprint at 97% of the predefined size (i.e. twice the concurrently collected metrics size). They automatically enter a survival mode when memory goes above this, by paralleling LRU evictions and metric data flushing (saving to disk). This system has 3 distinct levels of operation:
- aggressive evictions, when caches are above 99% full; in this mode cache query threads are turned into page evictors, trying to remove the least used data from the caches.
- critical evictions, when caches are above 101% full; in this mode every thread that accesses the cache is turned into a batch evictor, not leaving the cache until the cache size is again within acceptable limits.
- flushing critical, when too many unsaved data reside in memory; in this mode, flushing is parallelized, trying to push data to disk as soon as possible.
The caches are now shared across all dbengine instances (all tiers).
LRU evictions are now smarter: the caches know when metrics are referenced by queries or by collectors and favor the ones that have been used recently by data queries.
New dbengine query engine
The new dbengine query engine is totally asynchronous, working in parallel while other threads are processing metrics points. Chart and Context queries, but also Replication queries, now take advantage of this feature and ask dbengine to preload metric data in advance, before they are actually needed. This makes Netdata amazingly fast to respond in data queries, even on busy parent that at the same time collect millions of points.
At the same time we support prioritization of queries based on their nature:
- High priority queries, are all those that can potentially block data collection. Such queries are tiers backfilling and the last replication query for each metric (immediately after which, streaming is enabled).
- Normal priority queries, are the ones that are initiated by users.
- Low priority queries, are the ones that can be delayed without affecting quality of the results, like Health and Replication queries.
- Best effort queries, are the lowest priority ones and are currently used by ML training queries.
Starvation is prevented by allowing 2% of lower priority queries for each higher priority queue. So, even when backfilling is performed full speed at 15 million points per second, user queries are satisfied up to 300k points per second.
Internally all caches are partitioned to allow parallelism up to the number of cores the system has available. On busy parents with a lot of data and capable hardware it is now easy for Netdata to respond to queries using 10 million points per second.
At the same time, extent deduplication has been added, to prevent the unnecessary loading and uncompression of an extent multiple times in a short time. This works like this: while a request to load an extent is in flight, and up to the time the actual extent has been loaded and uncompressed in memory, more requests to extract data from it can be added to the same in flight request! Since dbengine trying to keep metrics of the same charts to the same extent, combined with the feature we added to prepare ahead multiple queries, this extent deduplication now provides hit of above 50% for normal chart and context queries!
Metrics registry
A new metrics registry has been added that maintains an index of all metrics in the database, for all tiers combined.
Initialization is the metrics registry is fully multithreaded utilizing all the resources available on busy parents, improving start-up times significantly.
This metrics registry is now the only memory requirement related to retention. It keeps in memory the first and the last timestamps, along with a few more metadata, of all the metrics for which retention is available on disk. The metrics registry needs about 150 bytes per metric.
Streaming
The biggest change in streaming is that the parent agents now inherit the clock of their children, for their data. So, all timestamps about collected metrics reflect the timestamps on the children that collected them. If a child clock is ahead of the parent clock, the parent will still accept collected points for the child, and it will process them and save them, but on parent node restart the parent will refuse to load future data about a child database. This has been done in such a way that if the clock of the child is fixed (by adjusting it backwards), after a parent restart the child will be able to push fresh metrics to the parent again.
Related to the memory footprint of the agent, streaming buffers were ballooning up to the configured size and remained like that for the lifetime of the agent. Now the streaming buffers are increased to satisfy the demand, but then they are again decreased to a minimum size. On busy parents this has a significant impact on the overall memory footprint of the agent (10MB buffer per node x 200 child nodes on this parent, is 2GB - now they return to a few KB per node).
Active-Active parent clusters are now more reliable by detecting stale child connections and disconnecting them.
Several child to parent connection issues have been solved.
Replication
Replication now uses the new features of dbengine and pipelines queries preparation and metric data loading, improving drastically its performance. At the same time, the replication step is now automatically adjusted to the page size of dbengine, allowing replication to use the data are already loaded by dbengine and saving resources at the next iteration.
A single replication thread can now push metrics at a rate of above 1 million points / second on capable hardware.
Solved an issue with replication, where if the replicated time-frame had a gap at the beginning of the replicated period, then no replication was performed for that chart. Now replication skips the gap and continues replicating all the points available.
Replication does not replicate now empty points. The new dbengine has controls in place to insert gaps into the database which metrics are missing. Utilizing this feature, we have now stopped replicating empty points, saving bandwidth and processing time.
Replication was increasing the streaming buffers above the configured ones, when big replication messages had to fit in it. Now, instead of increasing the streaming buffers, we interrupt the replication query at a point that the buffer will be sufficient to accept the message. When queries are interrupted like this, the remaining query is then repeated until all of it executed.
Replication and data collection are now synchronized atomically at the sending side, to ensure that the parent will not have gaps at the point the replication ends and streaming starts.
Replication had discrepancies when the db mode was not dbengine. To solve these discrepancies, combined with the storage layer API changes introduced by the new dbengine, we had to rewrite them to be compliant. Replication can now function properly, without gaps at the parents, even when the child has db mode alloc, ram, save or map.
Netdata startup and shutdown
Several improvements have been performed to speed up agent startup and shutdown. Combined with the new dbengine, now Netdata starts instantly on single node installations and uses just a fraction of the time that was needed by the previous stable version, even on very busy parents with huge databases (hundreds of GB).
Special care has been taken to ensure that during shutdown the agent prioritizes dbengine flushing to disk of any unsaved data. So, now during shutdown, data collection is first stopped and then the hot and dirty pages of the main cache are flushed to disk before proceeding with other cleanup activities.
Functions
After the groundwork done on the Netdata Agent in v1.37.0, Netdata Agent collectors are able to expose functions that can be executed on-demand, at run-time, by the data collecting agent, even when queries are executed via a Netdata Agent Parent. We are now utilizing this capability to provide the first of many powerful features via the Netdata Cloud UI.
Netdata Functions on Netdata Cloud allow you to trigger specific routines to be executed by a given Agent on request. These routines can range from a simple reader that fetches real time information to help you troubleshoot (like the list of currently running processing, currently running db queries, currently open connections, etc.), to routines that trigger an action on your behalf (restart a service, rotate logs, etc.), directly on the node. The key point is to remove the need to open an ssh connection to your node to execute a command like top while you are troubleshooting.
The routines are triggered directly from the Netdata Cloud UI, with the request going through the secure, already established by the agent Agent-Cloud Link (ACLK). Moreover, unlike many of the commands you'd issue from the shell, Netdata Functions come with powerful capabilities like auto-refresh, sorting, filtering, search and more! And, as everything about Netdata, they are fast!
What functions are currently available?
At the moment, just one, to display detailed information on the currently running processes on the node, replacing top and iotop. The function is provided by the apps.plugin collector.

How do functions work?
The nitty-gritty details are in PR "Allow netdata plugins to expose functions for querying more information about specific charts" (#13720). In short:
- Each plugin can register to the main Netdata agent process a set of functions that it supports for the host it runs (global functions), or a given chart (chart local functions), along with the acceptable parameters and parameter values for each one. The plugin also defines the format of the response it will provide, if a certain function is called.
- The agent makes the information available via its API, but also returns the available functions for a chart in the response of every
dataquery call, that returns the metric values. - To execute a registered function, one needs to call the
/api/v1/functionsendpoint (see it in swagger). However, for security reasons, the specific call is protected, meaning it is disabled from the HTTP API and will return a 403. Only the cloud can call the particular endpoint and only via the secure and protected Agent-Cloud Link (ACLK). - When the endpoint is called, the agent daemon invokes the requested function on the collector via a new plugins.d API endpoint. Note that the
plugins.dAPI has for the first time become bidirectional, precisely to support the daemon querying this type of information.
How do functions work with streaming?
The definitions of functions are transmitted to parent nodes via streaming, so that the parents know all the functions available on all child database they maintain. This works even across multiple levels of parents.
When a parent node is connected to Netdata Cloud, it is capable of triggering the call to the respective child node, to run any of its functions. When multiple parents are involved, all of them will propagate the request to the right child to execute the function.
Why are they available only on Netdata Cloud?
Since these functions are able to execute routines on the node and expose information beyond metric data (even action buttons could be implemented using functions), our concern is to ensure no sensitive information or disruptive actions are exposed through the unprotected Agent's API.
Since Netdata Cloud provides all the infrastructure to authenticate users, assign roles to them and establishes a secure communication channel to Netdata Agents ACLK, this concern is addressed. Netdata Cloud is free forever for everyone, providing a lot more than just the agent dashboard and is our main focus of development for new visualization features.
Next steps
For even more details please check our docs.
If you have ideas or requests for other functions:
- Participate in the relevant GitHub Discussion
- Open a feature request on the Netdata Cloud repo
- Engage with our community on the Netdata discord server.
Events feed
Coming by Feb 15th
The Events feed is a powerful new feature that tracks events that happen on your infrastructure, or in your Space. The feed lets you investigate events that occurred in the past, which is obviously invaluable for troubleshooting. Common use cases are ones like when a node goes offline, and you want to understand what events happened before that. A detailed event history can also assist in attributing sudden pattern changes in a time series to specific changes in your environment.
We start from humble beginnings, capturing topology events (node state transitions) and alert state transitions. We intend to expand the events we capture to include infrastructure changes like deployments or services starting/stopping and we plan to provide a way to display the events in the standard Netdata charts.
What are the available events?
⚠️ Based on your space's plan different allowances are defined to query past data. The length of the history is provided in this table:
| Domains of events | Community | Pro | Business |
|---|---|---|---|
| Topology events Node state transition events, e.g. live or offline. | 4 hours | 7 days | 14 days |
| Alert events Alert state transition events, can be seen as an alert history log. | 4 hours | 7 days | 90 days |
Topology events
| Event name | Description |
|---|---|
| Node Became Live | The node is collecting and streaming metrics to Cloud. |
| Node Became Stale | The node is offline and not streaming metrics to Cloud. It can show historical data from a parent node. |
| Node Became Offline | The node is offline, not streaming metrics to Cloud and not available in any parent node. |
| Node Created | The node is created, but it is still Unseen on Cloud, didn't establish a successful connection yet. |
| Node Removed | The node was removed from the Space through the Delete action, if it becomes Live again it will be automatically added. |
| Node Restored | The node is restored, if node becomes Live after a remove action it is re-added to the Space. |
| Node Deleted | The node is deleted from the Space, see this as an hard delete and won't be re-added to the Space if it becomes live. |
| Agent Claimed | The agent was successfully registered to Netdata Cloud and is able to connect. |
| Agent Connected | The agent connected to the Netdata Cloud MQTT server (Agent-Cloud Link established). |
| Agent Disconnected | The agent disconnected from the Netdata Cloud MQTT server (Agent-Cloud Link severed). |
| Agent Authenticated | The agent successfully authenticated itself to Netdata Cloud. |
| Agent Authentication Failed | The agent failed to authenticate itself to Netdata Cloud. |
Alert events
| Event name | Description |
|---|---|
| Node Alert State Changed | These are node alert state transition events and can be seen as an alert history log. You can see transitions to or from any of these states: Cleared, Warning, Critical, Removed, Error or Unknown |
Additional alert notification methods on Netdata Cloud
Coming by Feb 15th
Every Netdata Agent comes with hundreds of pre-installed health alerts designed to notify you when an anomaly or performance issue affects your node or the applications it runs. All these events, from all your nodes, are centralized at Netdata Cloud.
Before this release, Netdata Cloud was only dispatching centralized email alert notifications to your team whenever an alert enters a warning, critical, or unreachable state. However, the agent supported tens of notification delivery methods, which we hadn't provided via the cloud.
We are now adding to Netdata Cloud more alert notification integration methods. We categorize them similarly to our subscription plans, as Community, Pro and Business. On this release, we added Discord (Community Plan), web hook (Pro Plan), PagerDuty and Slack (Business Plan).

Notification method availability
⚠️ Netdata Cloud notification methods availability depends on your subscription plan.
| Notification methods | Community | Pro | Business |
|---|---|---|---|
| ✔️ | ✔️ | ✔️ | |
| Discord | ✔️ | ✔️ | ✔️ |
| Web hook | - | ✔️ | ✔️ |
| PagerDuty | - | - | ✔️ |
| Slack | - | - | ✔️ |
Notification method types
Notification integrations are classified based on whether they need to be configured per user (Personal notifications), or at the system level (System notifications).
Email notifications are Personal, meaning that administrators can enable or disable them globally, and each user can enable or disable them for them, per room. Email notifications are sent to the destination of the channel which is a user-specific attribute, e.g. user's e-mail. The users are the ones who can manage what specific configurations they want for the Space / Room(s) and the desired Notification level, via their User Profile page under Notifications.
All other introduced methods are classified as System, as the destination is a target that usually isn't specific to a single user, e.g. slack channel. These notification methods allow for fine-grain rule settings to be done by administrators. Administrators are able to specify different targets depending on Rooms or Notification level settings.
For more details please check the documentation here.
Improved role-based access model
Coming by Feb 15th
Netdata Cloud already provides a role-based-access mechanism, that allows you to control what functionalities in the app users can access.
Each user can be assigned only one role, which fully specifies all the capabilities they are afforded.
With the advent of the paid plans we revamped the roles to cover needs expressed by our users, like providing more limited access to your customers, or being able to join any room. We also aligned the offered roles to the target audience of each plan. The end result is the following:
| Role | Community | Pro | Business |
|---|---|---|---|
| Administrators This role allows users to manage Spaces, War Rooms, Nodes, Users, and Plan & Billing settings.Provides access to all War Rooms in the space | ✔️ | ✔️ | ✔️ |
| Managers This role allows users to manage War Rooms and Users. Provides access to all War Rooms and Nodes in the space. | - | - | ✔️ |
| Troubleshooters This role is for users focused on using Netdata to troubleshoot, not manage entities.Provides access to all War Rooms and Nodes in the space. | - | ✔️ | ✔️ |
| Observers This role is for read-only access, with restricted access to explicitly defined War Rooms and only the Nodes that appear in those War Rooms. 💡 Ideal for restricting your customer's access to their own dedicated rooms. | - | - | ✔️ |
| Billing This role is for users that only need to manage billing options and see invoices, with no further access to the system. | - | - | ✔️ |

Integrations
Collectors
Proc
The proc plugin gathers metrics from the /proc and /sys folders in Linux
systems, along with a few other endpoints, and is responsible for the bulk of the system metrics collected and
visualized by Netdata. It collects CPU, memory, disks, load, networking, mount points, and more.
We added a "cpu" label to the per core utilization % charts. Previously, the only way to filter or group by core was to use the "instance", i.e. the chart name. The new label makes the displayed dimensions much more user-friendly.
We fixed the issues we had with collection of CPU/memory metrics when running inside an LXC container as a systemd service.
We also fixed the missing network stack metrics, when IPv6 is disabled.
Finally, we improved how the loadavg alerts behave when the number of processors is 0, or unknown.
Apps
The apps plugin breaks down system resource usage
to processes, users and user groups, by reading whole process tree, collecting resource usage information for every process found running.
We fixed the nodejs application group node, which incorrectly included node_exporter. The rule now is that the process must be called node to be included in that group.
We also added a telegraf application group.
Containers and VMs (CGROUPS)
The cgroups plugin reads information on Linux Control Groups to monitor containers, virtual machines and systemd services.
The "net" section in a cgroups container would occasionally pick the wrong / random interface name to display in the navigation menu. We removed the interface name from the cgroup "net" family. The information is available in the cloud as labels and on the agent as chart names and ids.
eBPF
The eBPF plugin helps you troubleshoot and debug how applications interact with the Linux kernel.
We improved the speed and resource impact of the collector shutdown, by reducing the number of threads running in parallel.
We fixed a bug with eBPF routines that would sometimes cause kernel panic and system reboot on RedHat 8.* family OSs. #14090, #14131
We fixed an ebpf.d crash: sysmalloc Assertion failed, then killed with SIGTERM.
We fixed a crash when building eBPF while using a memory address sanitizer.
The eBPF collector also creates charts for each running application through an integration with the apps.plugin.
This integration helps you understand how specific applications interact with the Linux kernel. In systems with many VMs (like Proxmox), this integration
can cause a large load. We used to have the integration turned on by default, with the ability to disable it from ebpf.d.conf. We have now done the opposite, having the integration disabled by default, with the ability to enable it. #14147
Windows Monitoring
We have been making tremendous improvements on how we monitor Windows Hosts. The work will be completed in the next release. For now, we can say that we have done some preparatory work by adding more info to existing charts, adding metrics for MS SQL Server, IIS in 1.37, Active Directory, ADFS and ADCS.
We also reorganized the navigation menu, so that Windows application metrics don't appear under the generic "WMI" category, but on their own category, just like Linux applications.
We invite you to try out with these collectors either from a remote Linux machine, or using our new MSI installer, which however is not suitable for production. Your feedback will be really appreciated, as we invest on making Windows Monitoring a first class citizen of Netdata.
Generic Prometheus Endpoint Monitoring
Our Generic Prometheus Collector gathers metrics from any Prometheus endpoint that uses
the OpenMetrics exposition format.
To allow better grouping and filtering of the collected metrics we now create a chart with labels per label set.
We also fixed the handling of Summary/Histogram NaN values.
TCP endpoint monitoring
The TCP endpoint (portcheck) collector monitors TCP service availability and response time.
We enriched the portcheck alarms with labels that show the problematic host and port.
HTTP endpoint monitoring
The HTTP endpoint monitoring collector (httpcheck) monitors their availability and response time.
We enriched the alerts with labels that show the slow or unavailable URL relevant to the alert.
Host reachability (ping)
The new host reachability collector replaced fping in v1.37.0.
We removed the deprecated fping.plugin, in accordance with the v1.37.0 deprecation notice.
RabbitMQ
The RabbitMQ collector monitors the open source message broker, by
querying its overview, node and vhosts HTTP endpoints.
We added monitoring of the RabitMQ queues that was available in the older Python module and
fixed an issue with the new metrics.
MongoDB
We monitor the MongoDB NoSQL database serverStatus and dbStats.
To allow better grouping and filtering of the collected metrics we now create a chart per database, repl set member, shard and additional metrics. We also improved the cursors_by_lifespan_count chart dimension names, to make them clearer.
PostgreSQL
Our powerful PostgreSQL database collector has been enhanced with
an improved WAL replication lag calculation and better support of versions before 10.
Redis
The Redis collector monitors the in-memory data structure store via its INFO ALL command.
We now support password protected Redis instances, by allowing users to set the username/password in the collector configuration.
Consul
The Consul collector is production ready! Consul by HashiCorp is a powerful and complex identity-based networking solution, which is not trivial to monitor. We were lucky to have the assistance of HashiCorp itself in this endeavor, which resulted in a monitoring solution of exceptional quality. Look for common blog posts and announcements in the coming weeks!
NGINX Plus
The NGINX Plus collector monitors the load balancer, API gateway, and reverse proxy built on top of NGINX, by utilizing its Live Activity Monitoring capabilities.
We improved the collector that was launched last November with additional information explaining the charts and the addition of SSL error metrics.
Elastic Search
The Elastic Search collector monitors the search engine's instances
via several of the provided local interfaces.
To allow better grouping and filtering of the collected metrics we now create a chart per node index, a dimension per health status. We also added several OOB alerts.
NVIDIA GPU
Our NVIDIA GPU Collector monitors memory usage, fan speed, PCIE bandwidth utilization, temperature, and other GPU performance metrics using the nvidia-smi cli tool.
Multi-Instance GPU (MIG) is a feature from NVIDIA that lets users partition a single GPU to smaller GPU instances.
We added MIG metrics for uncorrectable errors and memory usage.
We also added metrics for voltage and PCIe bandwidth utilization percentage.
Last but not least, we significantly improved the collector's performance, by switching to collecting data using the CSV format.
Pi-hole
We monitor Pi-hole, the Linux network-level advertisement and Internet tracker blocking application via its PHP API.
We fixed an issue with the requests failing against an authenticated API.
Network Time Protocol (NTP) daemon
The ntpd program is an operating system daemon which sets and maintains the system time of day in synchronism with Internet standard time-servers (man page).
We rewrote our previous python.d collector in go, improving its performance and maintainability.
The new collector still monitors the system variables of a local ntpd daemon and optionally the variables of its polled peers.
Similarly to ntpq, the standard NTP query program, we used the NTP Control Message Protocol over a UDP socket.
The python collector will be deprecated in the next release, with no effect on current users.
Notifications
See Additional alert notification methods on Netdata Cloud
The agents can now send notifications to Mattermost, using the Slack integration! Mattermost has a Slack-compatible API that only required a couple of additional parameters. Kudos to @je2555!
Exporters
Netdata can export and visualize Netdata metrics in Graphite.
Our exporter was broken in v1.37.0 due to our host labels for ephemeral nodes. we fixed the issue with #14105.
Alerts and Notification Engine
Health Engine
To improve performance and stability, we made health run in a single thread.
Notifications Engine
The agent alert notifications are controlled by the configuration file health_alarm_notify.conf. Previously, if one used the |critical modifier, the recipients would always get at least 2 notifications: critical and clear. There was no way how to stop sending clear/warning notifications afterwards. We added the |nowarn and |noclear notification modifiers, to allow users to really receive just the transitions to the critical state.
We also fixed the broken redirects from alert notifications to cleared alerts.
Alerts
Chart labels in alerts
We constantly strive to improve the clarity of the information provided by the hundreds of out of the box alerts we provide.
We can now provide more fine-tuned information on each alert, as we started using specific chart labels instead of family.
To provide the capability we also had to change the format of alert info variables to support the more complex syntax.
Globally enable/disable specific alerts
Administrators can now globally, permanently disable specific OOB alerts via netdata.conf. Previously the options where to edit individual alert configuration files, or to use the health management API.
The [health] section of netdata.conf now support the setting enabled_alarms. It's value defines which alarms to load from both user and stock directories. The value is a simple pattern list of alarm or template names, with the default value of *, meaning that all alerts are loaded. For example, to disable specific alarms, you can provide enabled alarms = !oom_kill *, which will load all alarms except oom_kill.
Visualizations / Charts and Dashboards
Our main focus for visualization is on the Netdata Cloud Overview dashboard. This dashboard is our flagship, on which everything we do, all slicing and dicing capabilities of Netdata, are added and integrated. We are working hard to make this dashboard powerful enough, so that the need to learn a query language for configuring and customizing monitoring dashboards, will be eliminated.
On this release, we virtualized all items on the dashboard, allowing us to achieve exceptional performance on page rendering. In previous releases there were issues on dashboards with thousands of charts. Now the number of items in the page is irrelevant!
To make slicing and dicing of data easier, we ordered the on-chart selectors in a way that is more natural for most users:

This bar above the chart now describes the data presented, in plain English: On 6 out of 20 Nodes, group by dimension, the SUM() of 23 Instances, using All dimensions, each as AVG() every 3s
A tool-tip provides more information about the missing nodes:

And the drop-down menu now shows the exact nodes that contributed data to the query, together with a short explanation on why nodes did not provide any data:

Additionally, the pop-out icon next to each node can be used to jump to the single node dashboard of this node.
All the slicing and dicing controls (Nodes, Dimensions, Instances), now support filtering. As shown above, there is a search box in the drop-down and a tick-mark to the left of each item in the list, which can be used to instantly filter the data presented.
At the same time, we re-worked most of the Netdata collectors to add labels to the charts, allowing the chart to be pivoted directly from the group by drop-down menu. On the following image, we see the same chart as above, but now the data have been grouped by the label device, the values of which became dimensions of the chart.

The data can be instantly be filtered by original dimension (reads and writes in this example), like this:

or even by a specific instance (disk in this example), like this:

On the Instances drop down list (shown above), the pop-out icon to the right of each instance can be used to quickly jump to the single node dashboard, and we also made this function automatically scroll the dashboard to relative chart's position and filter on that chart the specific instance from which the jump was made.
Our goal is to polish and fine tune this interface, to the degree that it will be possible to slice and dice any data, without learning a query language, directly from the dashboard. We believe that this will simplify monitoring significantly, make it more accessible to people, and it will eventually allow all of us to troubleshoot issues without any prior knowledge of the underlying data structures.
At the same time, we worked to improve switching between rooms and tabs within a room, by saving the last visible chart and the selected page filters, we are restored automatically when the user switches back to the same room and tab.
For the ordering of the sections and subsections on the dashboard menu, we made a change to allow currently collected charts to overwrite the position of the section and subsection (we call it priority). Before this change, archived metrics (old metrics that are retained due to retention), were participating in the election of the priority for a section or subsection and because the retention Netdata maintains by default is more than a year, changes to the priority were never propagated to the UI.
Bug fixes
We fixed:
- The alignment of the anomaly rate pop-down chart
- The width of the right-hand menu bar
- A crash when filtering dimensions
- The warning when a user tries to leave the last space
- The filters of the Metric Correlation screen incorrectly persisting
- The wrong value being shown for whether a node has ML enabled
- The node filter on the anomalies tab
- The visibility of the chart actions menu that appears inside a chart
- Logstash metrics not being displayed in Netdata Cloud
- The home tab not being updated with the correct number of nodes, after deleting a node
Real Time Functions
See Functions
Events Feed
See Events Feed.
Database
New database engine
See Dramatic performance and stability improvements, with a smaller agent footprint
Metadata sync
Saving metadata to SQLite is now faster. Metadata saving starts asynchronously when the agent starts and continues as long as there are metadata to be saved. We implemented optimizations by grouping queries into transactions. At runtime this grouping happens per chart, which on shutdown it happens per host. These changes made metadata syncing up to 4x faster.
Streaming and Replication
We introduced very significant reliability and performance improvements to the streaming protocol and the database replication. See Streaming, Replication.
At the same time, we fixed SSL handshake issues on established SSL connections, provide stable streaming SSL connectivity between Netdata agents.
API
Data queries for charts and contexts now have the following additional features:
- The query planner that decided which tier to use for each query, now prefers higher tiers, to speed up queries
- Joining of multiple tiers to the same query now prefers higher resolution tiers and joining is accurate. To achieve that, behind the scenes the query planner expands the query of each tier to overlap with its previous and next and at the time they intersect, it reads points from all the overlapping tiers to decide how exactly the join should happen.
- Data queries now utilize the parallelism of the new dbengine, to pipeline query preparation of the dimensions of the chart or context being queried, and then preloading metric data for dimensions that are in the pipeline.
Machine Learning
We have been busy at work under the hood of the Netdata agent to introduce new capabilities that let you extend the "training window" used by Netdata's native anomaly detection capabilities.

We have introduced a new ML parameter called number of models per dimension which will control the number of most recently trained models used during scoring.
Below is some pseudo-code of how the trained models are actually used in producing anomaly bits (which give you an "anomaly rate" over any window of time) each second.
# preprocess recent observations into a "feature vector"
latest_feature_vector = preprocess_data([recent_data])

# loop over each trained model
for model in models:
    # if recent feature vector is considered normal by any model, stop scoring
    if model.score(latest_feature_vector) < dimension_anomaly_score_threshold:
        anomaly_bit = 0
        break
    else:
        # only if all models agree the feature vector is anomalous is it considered anomalous by netdata
        anomaly_bit = 1
The aim here is to only use those additional stored models when we need to. So essentially once one model suggests a feature vector looks anomalous we check all saved models and only when they all agree that something is anomalous does the anomaly bit get to be finally set to 1 to signal that Netdata considered the most recent feature vector unlike anything seen in all the models (spanning a wider training window) checked.
Read more in this blog post!
We now create ML charts on child hosts, when a parent runs a ML for a child. These charts use the parent's hostname to differentiate multiple parents that might run ML for a child.
Finally, we refactored the ML code and added support for multiple KMeans models.
Installation and Packaging
New hosting of build artifacts
We are always looking to improve the ways we make the agent available to users. Where we host our build artifacts is an important piece of the puzzle, and we've taken some significant steps in the past couple of months.
New hosting of nightly build artifacts
As of 2023-01-16, our nightly build artifacts are being hosted as GitHub releases on the new https://github.com/netdata/netdata-nightlies/ repository instead of being hosted on Google Cloud Storage. In most cases, this should have no functional impact for users, and no changes should be required on user systems.
New hosting of native package repositories
As part of improving support for our native packages, we are migrating off of Package Cloud to our own self-hosted package repositories located at https://repo.netdata.cloud/repos/. This new infrastructure provides a number of benefits, including signed packages, easier on-site caching, more rapid support for newly released distributions, and the ability to support native packages for a wider variety of distributions.
Our RPM repositories have already been fully migrated and the DEB repositories are currently in the process of being migrated.
Official Docker images now available on GHCR and Quay
In addition to Docker Hub, our official Docker images are now available on GHCR and Quay. The images are identical across all three registries, including using the same tagging.
You can use our Docker images from GHCR or Quay by either configuring them as registries with your local container tooling, or by using ghcr.io/netdata/netdata or quay.io/netdata/netdata instead of netdata/netdata.
kickstart
The directives --local-build-options and --static-install-options used to only accept a single option each. We now allow multiple options to be entered.
We renamed the --install option to --install-prefix, to clarify that it affects the directory under which the Netdata agent will be installed.
To help prevent user errors, passing an unrecognized option to the kickstart script now results in a fatal error instead of just a warning.
We previously used grep to get some info on login or group, which could not handle cases with centralized authentication like Active Directory or FreeIPA or pure LDAP. We now use "getent group" to get the group information.
RPMs
We fixed the required permissions of the cgroup-network and ebpf.plugin in RPM packages.
OpenSUSE
We fixed the binary package updates that were failing with an error on "Zypper upgrade".
FreeBSD
We fixed the missing required package installation of "tar".
MacOS
We fixed some crashes on MacOS.
Proxmox
Netdata on Proxmox virtualization management servers must be allowed to resolve VM/container names and read their CPU and memory limits.
We now explicitly add the netdata user to the www-data group on Proxmox, so that users don't have to do it manually.
Other
We fixed the path to "netdata.pid" in the logrotate postrotate script, which causes some errors during log rotation.
We also added pre gcc v5 support and allowed building without dbengine.
Documentation and Demos
Learn
We have been working hard to revamp Netdata Learn. We are revising not just its structure and content, but also the
Continuous Integration processes around it. We're getting close to the finish line, but you may notice that we currently publish two versions; 1.37.x
is frozen with the state of the docs as of the 1.37.1 release, and the nightly version has the target experience.
While not yet ready for production, the nightly version is the only place where information on the latest features and changes is available.
The following screenshot shows how you can switch between versions.
Be aware that you may encounter some broken links or missing pages while we are sorting out the several hundred markdown documents and several thousand links they include. We ask for your patience and expect that by the next release we'll have properly launched the new, more easy to navigate and use
version.
Demo space
The Netdata Demo space on Netdata Cloud is constantly being updated with new rooms, for various
use cases. You don't even need a cloud account to see our powerful infrastructure monitoring in action, so what are you waiting for?
Administration
Logging
We have improved the readability of our main error log file error.log, by moving data collection specific log messages to collector.log. For the same reason we reduced the log verbosity of streaming connections.
New configuration editing script
We reimplemented the edit-config script we install in the user config directory, adding a few new features, and fixing a number of outstanding issues with the previous script.
Overall changes from the existing script:
- Error messages are now clearly prefixed with
ERROR:instead of looking no different from other output from the script. - We now have proper support for command-line arguments. In particular,
edit-config --helpnow properly returns usage information instead of throwing an error. Other supported options are--filefor explicitly specifying the file to edit (using this is not required, but we should ideally encourage it), and--editorto specify an editor of choice on the command-line. - We now can handle editing configuration for a Docker container on the host side, instead of requiring it to be done in the container. This is done by copying the file out of the container itself. The script includes primitive auto-detection that should work in most common cases, but the user can also use the new
--containeroption to bypass the auto-detection and explicitly specify a container ID or name to use. Supports both Docker and Podman. - Instead of templating in the user config directory at build time, the script now uses the directory it was run from as the target for copying stock config files to. This is required for the above-mentioned Docker support, and also makes it a bit easier to test the script without having to do a full build of Netdata. Users can still override this by setting
NETDATA_USER_CONFIG_DIRin the environment, just like with the old script. - Similarly, instead of templating the stock config directory at build time, we now determine it at runtime by inspecting the
.environmentfile created by the install, falling back first to inferring the location from the script’s path and if that fails using the ‘default’ of/usr/lib/netdata/conf.d. From a user perspective, this changes nothing for any type of install we officially support and for any third-party packages I know of. This results in a slight simplification of the build code, as well as making testing of the script much easier (you can now literally just copy it to the right place, and it should work). Users can still override this by settingNETDATA_STOCK_CONFIG_DIR. - Instead of listing all known files in the help text, we now require the user to run the script with the
--listoption. This has two specific benefits:- It ensures that the actual usage information won’t end up scrolled off the top of the screen by the list of known files.
- It avoids the expensive container checks and stock config directory computation when the user just needs the help output.
- We now do a quick check of the validity of the editor (either auto-detected or user-supplied) instead of just blindly trusting that it’s usable. This should not result in any user-visible changes, but will provide a more useful error message if the user mistypes the name of their editor of choice.
- Instead of blindly excluding paths starting with
/or., we now do a proper prefix check for the supplied file path to make sure it’s under the user config directory. This provides tow specific benefits:- We no longer blindly copy files into directories that are not ours. For example, with the existing script, you can do
/etc/netdata/edit-config apps_groups.conf, and it will blindly copy the stockapps_groups.conffile to the current directory. With the new script, this will throw an error instead. - Invoking the script using absolute paths that point under the user config directory will work properly. In particular, this means that you do not need to be in the user config directory when invoking the script, provided you use a proper path. Running
netdata/edit-config netdata/apps_groups.confwhen in/etcwill now work, and/etc/netdata/edit-config /etc/netdata/apps_groups.confwill work from anywhere on the system.
- We no longer blindly copy files into directories that are not ours. For example, with the existing script, you can do
- If the requested file does not exist, and we do not provide a stock version of it, the script will now create an empty file instead of throwing an error. This is intended to allow it to behave better when dealing with configuration for third-party plugins (we may also want to define a standard location for third party plugins to store their stock configuration to improve this further, but that’s out of scope for this PR).
Netdata Monitoring
The new Netdata Monitoring section on our dashboard has dozens of charts detailing the operation of Netdata. All new components have their charts, dbengine, metrics registry, the new caches, the dbengine query router, etc.
At the same time, we added a chart detailing the memory used by the agent and the function it is used for. This was the hardest to gather, since information was spread all over the place, but thankfully the internals of the agents have changed drastically in the last few months, allowing us to have a better visibility on memory consumption. At its heart, the agent is now mainly an array allocator (ARAL) and a dictionary (indexed and ordered lists of objects), carefully crafted to achieve their maximum performance when multithreaded. Everything we do, from data collection, to health, streaming, replication, etc., is actually business logic on top of these elements.
CLI
netdatacli version now returns the version of netdata.
Other Notable Changes
Netdata Paid Subscriptions
Coming by Feb 15th
At Netdata we take pride in our commitment to the principle of providing free and unrestricted access to high-quality monitoring solutions. We offer our free SaaS offering - what we call the Community plan - and the Open Source Agent, which feature unlimited nodes and users, unlimited metrics, and retention, providing real-time, high-fidelity, out-of-the-box infrastructure monitoring for packaged applications, containers, and operating systems.
We also start providing paid subscriptions, designed to provide additional features and capabilities for businesses that need tighter and customizable integration of the free monitoring solution to their processes. These are divided into three different plans: Pro, Business, and Enterprise. Each plan offers a different set of features and capabilities to meet the needs of businesses of different sizes and with different monitoring requirements.
You can change your plan at any time. Any remaining balance will be credited to your account, even for yearly plans. Netdata designed this in order to respect the unpredictability of world dynamics. Less anxiety about choosing the right commitments in order to save money in the long run.

The paid Netdata Cloud plans work as subscriptions and overall consist of:
- A flat fee component (price per space)
- An on-demand, metered component, that is related to the usage of Netdata Cloud. For us, usage is directly linked to the number of nodes you have running, regardless of how many metrics each node collects. (see details below).
Netdata provides two billing frequency options:
- Monthly - Pay as you go, where we charge both the flat fee and the on-demand component every month
- Yearly - Annual prepayment, where we charge upfront the flat fee and committed amount related to your estimated usage of Netdata (see details below)
The detailed feature list and pricing in available in netdata.cloud/pricing.
Running nodes and billing
The only dynamic variable we consider for billing is the number of concurrently running nodes or agents. We only charge you for your active running nodes. We obviously don't count offline nodes, which were connected in a previous month and are currently offline, with their metrics unavailable. But we go further and don't count stale nodes either, which are available to query through a Netdata parent agent but are not actively collecting metrics at the moment.
To ensure we don't overcharge any user due to sporadic spikes throughout a month or even at a certain point in a day we:
- Calculate a daily P90 count of your running nodes. We take a daily snapshot of your running nodes, and using the node state change events (live, offline) we guarantee that a daily P90 figure is calculated to remove any temporary spikes within the day.
- Do a running P90 calculation from the start to the end of the monthly billing cycle. This way, we guarantee that we remove spikes that happened in just a couple of days within a single month.
:note: Even if you have a yearly billing frequency, we track the p90 counts monthly, to charge any potential overage over your committed nodes.
Committed nodes
When you subscribe to a Yearly plan you need to specify the number of nodes that you commit to. in addition to the discounted flat fee, you then get a 25% discount on the per node fee, as you're also committing to have those connected for a year. The charge for the committed nodes is part of your annual prepayment (node discounted price x committed nodes x 12 months).
If in a given month your usage is over these committed nodes, we charge the undiscounted cost per node for the overage.
Agent-Cloud link support for authenticated proxies
The Agent-Cloud link (ACLK) is the mechanism responsible for securely connecting a Netdata Agent to your web browser
through Netdata Cloud. The ACLK establishes an outgoing secure WebSocket (WSS) connection to Netdata Cloud on port
443. The ACLK is encrypted, safe, and is only established if you connect your node.
We have always supported unauthenticated HTTP proxies for the ACLK. We have now added support for HTTP Basic authentication.
We also fixed a race condition on the ACLK query thread startup.
Deprecation notice
The following items will be removed in our next minor release (v1.39.0):
Patch releases (if any) will not be affected.
| Component | Type | Will be replaced by |
|---|---|---|
| python.d/ntpd | collector | go.d/ntpd |
| python.d/proxysql | collector | go.d/proxysql |
| python.d/rabbitmq | collector | go.d/rabbitmq |
| python.d/nvidia_smi | collector | go.d/nvidia_smi |
Deprecated in this release
In accordance with our previous deprecation notice, the following items have been removed in this release:
| Component | Type | Replaced by |
|---|---|---|
| python.d/dockerd | collector | go.d/docker |
| python.d/logind | collector | go.d/logind |
| python.d/mongodb | collector | go.d/mongodb |
| fping | collector | go.d/ping |
- Removed Fedora 35 from the list of supported platforms
- Removed openSUSE Leap 15.3 from CI and support
- Dropped ARMv7 native packages for Fedora 36
Netdata Agent Release Meetup
Join the Netdata team on the 7th of February, at 17:00 UTC for the Netdata Agent Release Meetup.
Together we’ll cover:
- Release Highlights.
- Acknowledgements.
- Q&A with the community.
RSVP now - we look forward to meeting you.
Support options
As we grow, we stay committed to providing the best support ever seen from an open-source solution. Should you encounter an issue with any of the changes made in this release or any feature in the Netdata Agent, feel free to contact us through one of the following channels:
- Netdata Learn: Find documentation, guides, and reference material for monitoring and troubleshooting your systems with Netdata.
- GitHub Issues: Make use of the Netdata repository to report bugs or open a new feature request.
- GitHub Discussions: Join the conversation around the Netdata development process and be a part of it.
- Community Forums: Visit the Community Forums and contribute to the collaborative knowledge base.
- Discord Server: Jump into the Netdata Discord and hang out with like-minded sysadmins, DevOps, SREs, and other troubleshooters. More than 1400 engineers are already using it!
Acknowledgements
We would like to thank our dedicated, talented contributors that make up this amazing community. The time and expertise
that you volunteer are essential to our success. We thank you and look forward to continuing to grow together to build a
remarkable product.
- @je2555 for enabling alert notifications to Mattermost using Slack-compatible webhooks.
- @rex4539 for fixing various typos in documentation.
- @artemsafiyulin for fixing the replication lag calculation of the postgreSQL collector.
- @vobruba-martin for adding
|nowarnand|noclearnotification modifiers to agent notifications. - @ghanapunq for adding PCIe bandwidth utilization metrics to NVIDIA GPU monitoring.
- @Kerleyark and @mikerenfro for verifying that the CSV format significantly improves the performance of the NVIDIA GPU collector.
- @martindue for fixing the negative temperatures bug in 1-wire sensor monitoring.
New Contributors
- @je2555 made their first contribution in https://github.com/netdata/netdata/pull/14153
- @ghanapunq made their first contribution in https://github.com/netdata/netdata/pull/14315
- @martindue made their first contribution in https://github.com/netdata/netdata/pull/14435
Full Changelog: https://github.com/netdata/netdata/compare/v1.37.0...v1.38.0
Published by netdatabot almost 2 years ago
Netdata v1.37.1 is a patch release to address issues discovered since v1.37.0. Refer to the v.1.37.0 release notes for the full scope of that release.
The v1.37.1 patch release fixes the following issues:
- Parent agent crash when many children instances (re)connect at the same time, causing simultaneous SSL re-initialization (PR #14076).
- Agent crash during dbengine database file rotation while a page is being read while being deleted (PR #14081).
- Agent crash on metrics page alignment when metrics were stopped being collected for a long time and then started again (PR #14086).
- Broken Fedora native packages (PR #14082).
- Fix dbengine backfilling statistics (PR #14074).
In addition, the release contains the following optimizations and improvements:
- Improve workers statistics performance (PR #14077).
- Improve replication performance (PR #14079).
- Optimize dictionaries (PR #14085).
Support options
As we grow, we stay committed to providing the best support ever seen from an open-source solution. Should you encounter
an issue with any of the changes made in this release or any feature in the Netdata Agent, feel free to contact us
through one of the following channels:
- Netdata Learn: Find documentation, guides, and reference material for monitoring and troubleshooting your systems with Netdata.
- GitHub Issues: Make use of the Netdata repository to report bugs or open a new feature request.
- GitHub Discussions: Join the conversation around the Netdata development process and be a part of it.
- Community Forums: Visit the Community Forums and contribute to the collaborative knowledge base.
- Discord: Jump into the Netdata Discord and hang out with like-minded sysadmins, DevOps, SREs, and other troubleshooters. More than 1300 engineers are already using it!
Published by netdatabot almost 2 years ago
IMPORTANT NOTICE
This release fixes two security issues, one in streaming authorization and another at the execution of alarm notification commands. All users are advised to update to this version or any later! Credit goes to Stefan Schiller of SonarSource.com for identifying both of them. Thank you, Stefan!
Netdata release v1.37 introduction
Another release of the Netdata Monitoring solution is here!
We focused on these key areas:
- Infinite scalability of the Netdata Ecosystem
- Default Database Tiering, offering months of data retention for typical Netdata Agent installations with default settings and years of data retention for dedicated Netdata Parents.
- Overview Dashboards at Netdata Cloud got a ton of improvements to allow slicing and dicing of data directly on the UI and overcome the limitations of the web technology when thousands of charts are presented on one page.
- Integration with Grafana for custom dashboards, using Netdata Cloud as an infrastructure-wide time-series data source for metrics
- PostgreSQL monitoring completely rewritten offering state-of-the-art monitoring of the database performance and health, even at the table and index level.
Read more about this release in the following sections!
Table of contents
-
Release Highlights
- Infinite scalability
- Database retention
- New and improved system service integration
- Plugins function extension
- Disk based data indexing
- Overview dashboard
- Single node dashboard improvements
- Netdata data source plugin for Grafana
- New Unseen node state
- Blogposts & demo space use-case rooms
- Tech debt and performance improvements
- Internal Improvements
- Acknowledgments
- Contributions
- Deprecation and product notices
- Netdata release meetup
- Support options
❗ We're keeping our codebase healthy by removing features that are end of life. Read the deprecation notices to check if you are affected.
Netdata open-source growth
- Over 61,000 GitHub Stars
- Almost four million monitored servers
- Almost 85 million sessions served
- Rapidly approaching a half million total nodes in Netdata Cloud
Release highlights
Infinite scalability
Scalability is one of the biggest challenges of monitoring solutions. Almost every commercial or open-source solution assumes that metrics should be centralized to a time-series database, which is then queried to provide dashboards and alarms. This centralization, however, has two key problems:
- The scalability of the monitoring solutions is significantly limited, since growing these central databases can quickly become tricky, if it is possible at all.
- To improve scalability and control the monitoring infrastructure cost, almost all solutions limit granularity (the data collection frequency) and cardinality (the number of metrics monitored).
At Netdata we love high fidelity monitoring. We want granularity to be "per second" as a standard for all metrics, and we want to monitor as many metrics as possible, without limits.

Netdata Cloud does not collect or store all the data collected; that is one of its most beautiful and unique qualities. It only needs active connections to the Netdata Agents having the metrics. The Netdata Agents store all metrics in their own time-series databases (we call it dbengine, and it is embedded into the Netdata Agents).
In this release, we introduce a new way for the Agents to communicate their metadata to the cloud. To minimize the amount of traffic exchanged between Netdata Cloud and Agents, we only transfer a very limited information of metadata. We call this information contexts, and it is pretty much limited to the unique metric names collected, coupled with the actual retention (first and last timestamps) that each agent has available for query.
At the same time, to overcome the limitations of having hundreds of thousands of Agents concurrently connected to Netdata Cloud, we are now using EMQX as the message broker that connects Netdata Agents to Netdata Cloud. As the community grows, the next step planned is to have such message brokers in five continents, to minimize the round-trip latency for querying Netdata Agents through Netdata Cloud.
We also see Netdata Parents as a key component of our ecosystem. A Netdata Parent is a Netdata Agent that acts as a centralization point for other Netdata Agents. The idea is simple: any Netdata Agent (Child) can delegate all its functions, except data collection, to any other Netdata Agent (Parent), and by doing so, the latter now becomes a Netdata Parent. This means that metrics storage, metrics querying, health monitoring, and machine learning can be handled by the Netdata Parent, on behalf of the Netdata Children that push metrics to it.
This functionality is crucial for our ecosystem for the following reasons:
- Some nodes are ephemeral and may vanish at any point in time. But we need their metric data.
- Other nodes may be too sensitive to run all the features of a Netdata Agent. On such nodes we needed a way to use the absolute minimum of system resources for anything else except the core application that the node is hosting. So, on these Netdata Agents we can disable metrics storage, health monitoring, machine learning and push all metrics to another Netdata Agent that has the resources to spare for these tasks.
- High availability of metric data. In our industry, "one = none." We need at least 2 of everything and this is true for metric data too. Parents allow us to replicate databases, even having different retention on each, thus significantly improving the availability of metrics data.
In this release we introduce significant improvements to Netdata Parents:
- Streaming CompressionThe communication between Netdata Agents is now compressed using LZ4 streaming compression, saving more than 70% of the bandwidth. TLS communication was already implemented and can be combined with compression.
- Active-Active Parents ClustersA Parent cluster of 2+ nodes can be configured by linking each of the parents to the others. Our configuration can easily take care of the circular dependency this implies. For 2 nodes you configure: A->B and B<-A. For 3 nodes: A->B/C, B->A/C, C->A/B. Once the parents are set up, configure Netdata Agents to push metrics to any of them (for 2 Parent nodes: A/B, for 3 Parent nodes: A/B/C). Each Netdata Agent will send metrics to only one of the configured parents at a time. But any of them. Then the Parent agents will re-stream metrics to each other.
-
Replication of past dataNow Parents can request missing data from each other and the origin data collecting Agent. This works seamlessly when two agents connect to each other (both have to be the latest version). They exchange information about the retention each has and they automatically fill in the gaps of the Parent agent, ensuring no data are lost at the Parents, even if a Parent was offline for some time (the default max replication duration is 1 day, but it can be tuned in
stream.conf- and the connecting Agent Child needs to have data for at least that long in order for them to be replicated). - Performance ImprovementsNow Netdata Parents can digest about 700k metric values per second per origin Agent. This is a huge improvement over the previous one of 400k. Also, when establishing a connection, the agents can accept about 2k metadata definitions per second per origin Agent. We moved all metadata management to a separate thread, and now we are experiencing 80k metric definitions per second per origin Agent, making new Agent connections enter the metrics streaming phase almost instantly.
All these improvements establish a huge step forward in providing an infinitely scalable monitoring infrastructure.
Database retention
Many users think of Netdata Agent as an amazing single node-monitoring solution, offering limited real-time retention to metrics. This changed slightly over the years as we introduced dbengine for storing metrics and even with the introduction of database tiering at the previous release, allowing Netdata to downscale metrics and store them for a longer duration.
As of this release, we now enable tiering by default! So, a typical Netdata Agent installation, with default settings, will now have 3 database tiers, offering a retention of about 120 - 150 days, using just 0.5 GB of disk space!
This is coupled with another significant achievement. Traditionally, the Agent dashboard showed only currently collected metrics. The dashboard of Netdata Cloud however, should present all the metrics that were available for the selected time-frame, independently of whether they are currently being collected or not. This is especially important for highly volatile environments, like Kubernetes, that metrics come and go all the time.
So, in this release, we rewrote the query engine of the Netdata Agent to properly query metrics independently of them being currently collected or not. In practice, the Agent is now sliced in two big modules: data collection and querying. These two parts do not depend on each other any more, allowing dashboards to query metrics for any time-frame there are data available.
This feature of querying past data even for non-collected metrics is available now via Netdata Cloud Overview dashboards.
New and improved system service integration
We have completely rewritten the part of the installer responsible for setting up Netdata as a system service. This includes a number of major improvements over the old code, including the following:
- Instead of deciding which type of system service to install based on the distribution name and release, we now actively detect which service manager is in use and use that. This provides significantly better behavior on non-systemd systems, many of which were not actually getting the correct service type installed.
- On FreeBSD systems, we now correctly install the rc.d script for Netdata to
/usr/local/etc/rc.dinstead of/etc/rc.d. - We now correctly enable and disable the agent as a system service correctly for all service managers we officially support. In particular, this means that users who are using a supported service manager should not need to do anything to enable the service.
- Similarly, we now properly start the agent through the system service manager for all supported service managers.
- We now have improved support for installing as a system service under WSL, including support for systemd in WSL, and correct fallbacks to LSB or initd style init scripts. This should make using Netdata under WSL much easier.
- We now support installing service files for Netdata on offline systemd or OpenRC systems. This should greatly simplify installing the agent in containers or as part of setting up a virtual machine template.
- Numerous minor improvements.
Additionally, this release includes a number of improvements to our OpenRC init script, bringing it more in-line with best practices for OpenRC init scripts, fixing a handful of bugs, and making it easier to run Netdata under OpenRC’s native process supervision.
We plan to continue improving this area in upcoming release cycles as well, including further improvements to our OpenRC support and preliminary support for installing Netdata as a service on systems using Runit.
Plugins function extension
As of this release, plugins can now register functions to the agent that can be executed on demand to provide real time, detailed and specific chart data. Via streaming, the definitions of functions are now transmitted to a parent and seamlessly exposed to the agent.
Disk based data indexing
Agents now build an optimized disk-based index file to reduce memory requirements up to 90%. In turn, the Agent startup time improved by 1,000% (You read this right; this is not a typo!).
Overview dashboard
The Overview dashboard is the key dashboard of the Netdata ecosystem. We are constantly putting effort into improving this dashboard so that it will eventually be unnecessary to use anything else.
Unlike the Netdata Agent dashboard, the Netdata Cloud Overview dashboard is multi-node, providing infrastructure and service level views of the metrics, seamlessly aggregating and correlating metrics from all Netdata Agents that participate in a war room.
We believe that dashboards should be fully automated and out-of-the-box, providing all the means for slicing and dicing data without learning any query language, without editing chart definitions, and without having a deep understanding of the underlying metrics, so that the monitoring system is fully functional and ready to be used for troubleshooting the moment it is installed.
Moving towards this goal, in this release we introduce the following improvements:
- A complete rewrite of the underlying core of the dashboard offers now huge performance improvements on dashboards with thousands of charts. Before this work, when the dashboard had thousands of charts, several seconds were required to jump from the top of the dashboard to the end. Now it is instant.
- We went through all the data collection plugins and metrics and we added labels to all of them, allowing the default charts on the Overview dashboard to pivot the charts, slicing and dicing the data according to these labels. For example, network interfaces charts can be pivoted by device name or interface type, while at the same time filtered by any of the labels, dimensions, instances or nodes.

- We have started working on new summary tiles to outlook the sections of the dashboard in a more dynamic manner. This work has just started and we expect to introduce a lot of new changes heading into the next releease

Single node dashboard improvement
The Single Node view dashboard now uses the same engine as the Overview.
With this, you get a more consistent experience, but also:
- The ability to run metric correlations across many nodes in your infrastructure.
- All the grouping and filtering functions of the overview.
- Reduced memory usage on the agent, as the old endpoints get deprecated.
We are working to bring similar improvements to the local Agent dashboard. In the meantime, it will look different than the Single Node view on Netdata Cloud. On Netdata Cloud we use composite charts, instead of separate charts, for each instance.

Netdata data source plugin for Grafana
This initial release of the Netdata data source plugin aims to maximize the troubleshooting capabilities of Netdata in Grafana, making them more widely available. It combines Netdata’s powerful collector engine with Grafana's amazing visualization capabilities!

We expect that the Open-Source community will take a lot of value from this plugin, so we don’t plan on stopping here. We want to keep improving this plugin! We already have some enhancements on our backlog, including the following plans:
- Enabling variable functionality
- Allowing filtering with multiple key-value combinations)
- Providing sample templates for certain use-cases, e.g. monitoring PostgreSQL
We would love to get you involved in this project! If you have ideas on things you'd like to see or just want to share a cool dashboard you've setup, you're more than welcome to contribute.
Check out our blogpost and YouTube video on this new plugin to see how it can work best for you.
New Unseen node state
To provide better visibility on different causes for why a node is Offline, we broke this status in to two separate statuses, so that you can now distinguish cases where a node never connected to Netdata Cloud successfully.
The following list presents our current node's statuses and their meaning:
- Live: Node is actual collecting and streaming metrics to Cloud
- Stale: Node is currently offline and no streaming metrics to Cloud. It can show historical data from a parent node
- Offline: Node is currently offline, not streaming metrics to Cloud and not available in any parent node
- Unseen: Nodes have never been connected to Cloud, they are claimed but no successful connection was established
There are different reasons why a node can't connect; the most common explanation for this falls into one of the following three categories:
- The claiming process of the kickstart script was unsuccessful
- Claiming on an older, deprecated version of the Agent
- Network issues while connecting to the Cloud
For some guidelines on how to solve these issues, check our docs here.
Blogposts & Demo space use-case rooms
To better showcase the potentialities and upgrades of Netdata, we have made available multiple rooms in our Demo space to allow you to experience the power and simplicity of Netdata with live infrastructure monitoring.
PostgreSQL monitoring
Netdata's new PostgreSQL collector offers a fully revamped comprehensive PostgreSQL DB monitoring experience. 100+ PostrgreSQL metrics are collected and visualized across 60+ composite charts. Netdata now collects metrics at per database, per table and per index granularity (besides the metrics that are global to the entire DB cluster) and lets users explore which table or index has a specific problem such as high cache miss, low rows fetched ratio (indicative of missing indexes) or bloat that's eating up valuable space. The new collector also includes built-in alerts for several problem scenarios that a user is likely to run into on a PostgreSQL cluster. For more information, read our docs or our blogfor a deep dive into PostgreSQL and why these metrics matter.

Redis monitoring
Netdata's Redis collector was updated to include new metrics crucial for database performance monitoring such as latency and new built-in alerts. For the full list of Redis metrics now available, read our docs or our blog for a deeper dive into Redis monitoring.

Cassandra monitoring
Netdata now monitors Cassandra, and comes with 25+ charts for all key Cassandra metrics. The collected metrics include throughput, latency, cache (key cache + row cache), disk usage and compaction, as well as JVM runtime metrics such as garbage collection. Any potential errors and exceptions that occur on your Cassandra cluster are also monitored. For more information read our docs or our blog.

Tech debt and Infrastructure improvements
To further improve Netdata Cloud and your user experience, multiple points around tech debt and infrastructure improvements have been completed. To name some of the key achievements:
- An huge improvement has been made on our Overview tab on Netdata Cloud; we improved the performance around the navigation on the Table of Contents (TOC) and the charts on the viewport, contributing to a much better UX
- The repos that support our FE have all been upgraded to node 16, putting us on the Active Long Term Support (LTS) version
- We've replaced our MQTT broker VerneMQ with EMQX, which brings much more stability to the product.
Internal improvements
Asynchronous storing of metadata
We have improved the speed of chart creation by 70x. According to lab tests creating 30,000 charts with 10 dimensions each,
we achieved a chart creation rates of 7000 charts/second (vs 100 charts/second prior)
Per host alert processing.
Alert processing for a host (e.g. child connected to a parent) is now done on its own host. Time-consuming health related initialization functions are deferred as needed and parallelized to improve performance.
Dictionary code improvements
Code improvements have been made to make use of dictionaries, better managing the life cycle of objects (creation, usage, and destruction using reference counters) and reducing explicit locking to access resources.
Acknowledgments
We would like to thank our dedicated, talented contributors that make up this amazing community. The time and expertise that you volunteer is essential to our success. We thank you and look forward to continue to grow together to build a remarkable product.
- @HG00 for improving RabbitMQ collector readme.
- @KickerTom for improving Makefiles.
- @MAH69IK for adding an option to retry on telegram API limit error.
- @Pulseeey for adding CloudLinux OS detection during installation and update.
- @candrews for improving netdata.service.
- @uplime for fixing a typo in netdata-installer.sh.
- @vobruba-martin for adding TCP socket connection support and the state path modification.
- @yasharne for adding ProxySQL collector.
Contributions
Collectors
⚙️ Enhancing our collectors to collect all the data you need.
New collectors
- Add Pandas collector (python.d/pandas) (#13773, @andrewm4894)
- Add NGINX Plus collector (go.d/nginxplus) (#992, @ilyam8)
- Add NVMe collector (go.d/nvme) (#973, @ilyam8)
- Add Ping collector (go.d/ping) (#952, @ilyam8)
- Add Cassandra collector (go.d/cassandra) (#901, @thiagoftsm)
- Add systemd-logind collector (go.d/logind) (#786, @ilyam8)
- Add Docker collector (go.d/docker) (#760, @ilyam8)
- Add PgBouncer collector (go.d/pgbouncer) (#748, @ilyam8)
- Add ProxySQL collector (go.d/proxysql) (#703, @yasharne)
Improvements
🐞 Improving our collectors one bug fix at a time.
- Allow statsd tags to modify chart metadata on the fly (stats.d.plugin) (#14014, @ktsaou)
- Add Cassandra icon to dashboard info (go.d/cassandra) (#13975, @ilyam8)
- Add ping dashboard info and alarms (go.d/ping) (#13916, @ilyam8)
- Add WMI Process dashboard info (go.d/wmi) (#13910, @thiagoftsm)
- Add processes dashboard info (go.d/wmi) (#13910, @thiagoftsm)
- Add TCP dashboard description (go.d/wmi) (#13878, @thiagoftsm)
- Add Cassandra dashboard description (go.d/cassandra) (#13835, @thiagoftsm)
- Respect NETDATA_INTERNALS_MONITORING (python.d.plugin) (#13793, @ilyam8)
- Add ZFS hit rate charts (proc.plugin) (#13757, @vlvkobal)
- Add alarms filtering via config (python.d/alarms) (#13701, @andrewm4894)
- Add ProxySQL dashboard info (go.d/proxysql) (#13669, @ilyam8)
- Update PostgreSQL dashboard info (go.d/postgres) (#13661, @ilyam8)
- Add _collect_job label (job name) to charts (python.d.plugin) (#13648, @ilyam8)
- Re-add chrome to the webbrowser group (apps.plugin) (#13642, @Ferroin)
- Add labels to charts (tc.plugin) (#13634, @ktsaou)
- Improve the gui and email app groups and improve GUI coverage (apps.plugin) (#13631, @Ferroin)
- Update Postgres "connections" dashboard info (go.d/postgres) (#13619, @ilyam8)
- Assorted updates for apps_groups.conf (apps.plugin) (#13618, @Ferroin)
- Add spiceproxy to proxmox group (apps.plugin) (#13615, @ilyam8)
- Improve coverage of Linux kernel threads (apps.plugin) (#13612, @Ferroin)
- Improve dashboard info for WAL and checkpoints (go.d/postgres) (#13607, @shyamvalsan)
- Update logind dashboard info (go.d/logind) (#13597, @ilyam8)
- Add collecting power state (python.d/nvidia_smi) (#13580, @ilyam8)
- Improve PostgreSQL dashboard info (go.d/postgres) (#13573, @shyamvalsan)
- Add apt group to apps_groups.conf (apps.plguin) (#13571, @andrewm4894)
- Add more monitoring tools to apps_groups.conf (apps.plugin) (#13566, @andrewm4894)
- Add docker dashboard info (go.d/docker) (#13547, @ilyam8)
- Add discovering chips, and features at runtime (python.d/sensors) (#13545, @ilyam8)
- Add summary dashboard for PostgreSQL (go.d/postgres) (#13534, @shyamvalsan)
- Add jupyter to apps_groups.conf (apps.plugin) (#13533, @andrewm4894)
- Improve performance and add co-re support for more modules (ebpf.plugin) (#13530, @thiagoftsm)
- Use LVM UUIDs in chart ids for logical volumes (proc.plugin) (#13525, @vlvkobal)
- Reduce CPU and memory usage (ebpf.plugin) (#13397, @thiagoftsm)
- Add 'domain' label to charts (go.d/whoisquery) (#1002, @ilyam8)
- Add 'source' label to charts (go.d/x509check) (#1001, @ilyam8)
- Add 'host' label to charts (go.d/portcheck) (#1000, @ilyam8)
- Add 'url' label to charts (go.d/httpcheck) (#999, @ilyam8)
- Remove pipeline instance from family and add it as a chart label (go.d/logstash) (#998, @ilyam8)
- Add http cache io/iops metrics (go.d/nginxplus) (#997, @ilyam8)
- Add resolver metrics (go.d/nginxplus) (#996, @ilyam8)
- Add MSSQL metrics (go.d/wmi) (#991, @thiagoftsm)
- Add IIS data collection job (go.d/web_log) (#977, @thiagoftsm)
- Add IIS metrics (go.d/wmi) (#972, @thiagoftsm)
- Add services metrics (go.d/wmi) (#961, @thiagoftsm)
- Resolve 'hostname' in job name (go.d.plugin) (#959, @ilyam8)
- Add processes metrics (go.d/wmi) (#953, @thiagoftsm)
- Resolve 'hostname' in URL (go.d.plugin) (#941, @ilyam8)
- Add TCP metrics (go.d/wmi) (#938, @thiagoftsm)
- Add collection of Table_open_cache_overflows (go.d/dns_query) (#936, @ilyam8)
- Allow to set a list of record types in config (go.d/dns_query) (#912, @ilyam8)
- Create a chart per server instead of a dimension per server (go.d/dns_query) (#911, @ilyam8)
- Respect NETDATA_INTERNALS_MONITORING env variable (go.d.plugin) (#908, @ilyam8)
- Add query status chart (go.d/dns_query) (#903, @ilyam8)
- Add collection of agent metrics (go.d/consul) (#900, @ilyam8)
- Create a chart per health check (go.d/consul) (#899, @ilyam8)
- Add collection of master link status (go.d/redis) (#856, @ilyam8)
- Add collection of master slave link metrics (go.d/redis) (#851, @ilyam8)
- Add collection of time elapsed since last RDB save (go.d/redis) (#850, @ilyam8)
- Add ping latency chart (go.d/redis) (#849, @ilyam8)
- Check for 'connect' privilege before querying database size (go.d/postgres) (#845, @ilyam8)
- Allow to set data collection job labels in config (go.d.plugin) (#840, @ilyam8)
- Improve histogram buckets dimensions (go.d/postgres) (#833, @ilyam8)
- Add acquired locks utilization chart (go.d/postgres) (#831, @ilyam8)
- Add _collect_job label (job name) to charts (go.d.plugin) (#814, @ilyam8)
- Add TCP socket connection support and the state path modification (go.d/phpfpm) (#805, @vobruba-martin)
- Create a dimension for every unit state (go.d/systemdunits) (#795, @ilyam8)
- Improve Galera state and status charts (#779, @ilyam8)
- Add discovering dhcp-ranges at runtime (go.d/dnsmasq_dhcp) (#778, @ilyam8)
- Add collecting image and volume stats (go.d/docker) (#777, @ilyam8)
- Add Percona MySQL compatibility (go.d/mysql) (#776, @ilyam8)
- Add collection of additional user statistics metrics (#775, @ilyam8)
Bug fixes
- Fix eBPF crashes on exit (ebpf.plugin) (#14012, @thiagoftsm)
- Fix not working on Oracle linux (ebpf.plugin) (#13935, @thiagoftsm)
- Fix retry logic when reading network interfaces speed (proc.plugin) (#13893, @ilyam8)
- Fix systemd chart update (ebpf.plugin) (#13884, @thiagoftsm)
- Fix handling qemu-1- prefix when extracting virsh domain (#13866, @ilyam8)
- Fix collection of carrier, duplex, and speed metrics when network interface is down (proc.plugin) (#13850, @vlvkobal)
- Fix various issues (ebpf.plugin) (#13624, @thiagoftsm)
- Fix apps plugin users charts description (apps.plugin) (#13621, @ilyam8)
- Fix chart id length check (cgroups.plugin) (#13601, @ilyam8)
- Fix not respecting update_every for polling (python.d/nvidia_smi) (#13579, @ilyam8)
- Fix containers name resolution when Docker is a snap package (cgroups.plugin) (#13523, @ilyam8)
- Fix handling string and float values (go.d/nvme) (#993, @ilyam8)
- Fix handling ExpirationDate with space (go.d/whoisquery) (#974, @ilyam8)
- Fix query queryable databases (go.d/postgres) (#960, @ilyam8)
- Fix not respecting headers config option (go.d/pihole) (#942, @ilyam8)
- Fix dns_queries_percentage metric calculation (go.d/pihole) (#922, @ilyam8)
- Fix data collection when auth.bind query is not supported (go.d/dnsmasq) (#902, @ilyam8)
- Fix data collection when too many db tables and indexes (go.d/postgres) (#857, @ilyam8)
- Fix creation of bloat charts if no bloat metrics collected (go.d/postgres) (#846, @ilyam8)
- Fix unregistering connStr at runtime (go.d/postgres) (#843, @ilyam8)
- Fix bloat size percentage calculation (go.d/postgres) (#841, @ilyam8)
- Fix charts when binary log and MyISAM are disabled (go.d/mysql) (#763, @ilyam8)
- Fix data collection jobs cleanup on exit (go.d.plugin) (#758, @ilyam8)
- Fix handling the case when no images are found (go.d/docker) (#739, @ilyam8)
Other
- Don't let slow disk plugin thread delay shutdown (#14044, @MrZammler)
- Remove nginx_plus collector (python.d.plugin) (#13995, @ilyam8)
- Enable collecting ECC memory errors by default (#13970, @ilyam8)
- Make Statsd dictionaries multi-threaded (#13938, @ktsaou)
- Remove NFS readahead histogram (proc.plugin) (#13819, @vlvkobal)
- Merge netstat, snmp, and snmp6 modules (proc.plugin) (#13806, @vlvkobal)
- Rename dockerd job on lock registration (python.d/dockerd) (#13537, @ilyam8)
- Remove python.d/* announced in v1.36.0 deprecation notice (python.d.plugin) (#13503, @ilyam8)
- Remove blocklist file existence state chart (go.d/pihole) (#914, @ilyam8)
- Remove instance-specific information from chart families (go.d/portcheck) (#790, @ilyam8)
- Remove spaces in "HTTP Response Time" chart dimensions (go.d/httpcheck) (#788, @ilyam8)
Documentation
📄 Keeping our documentation healthy together with our awesome community.
Updates
- Add Alpine 3.17 to supported distros (#14056, @Ferroin)
- Fix securing streaming communications steps (#14024, @thiagoftsm)
- Fix a typo in Uninstall docs (#14002, @tkatsoulas)
- Use calculator app instead of spreadsheet (#13981, @andrewm4894)
- Document password param for tor collector (#13966, @andrewm4894)
- Reference the bash collector for RPi (#13907, @cakrit)
- Improve intro paragraph for sensors collector (#13906, @cakrit)
- Add pandas collector to collectors.md (#13895, @andrewm4894)
- Update dbengine options in step-09.md (#13864, @DShreve2)
- Fix a typo in pandas collector readme (#13853, @andrewm4894)
- Add up-to-date info on improving performance (#13801, @cakrit)
- Update fping plugin documentation with better details about the required version (#13765, @Ferroin)
- Provide details on label filtering/custom labels (#13745, @DShreve2)
- Add a note that nvidia-smi does not work inside a container (#13695, @ilyam8)
- Add info for Docker containers about using hostname from host (#13685, @Ferroin)
- Update dictionary documentation (#13679, @ktsaou)
- Update uninstaller documentation (#13627, @Ferroin)
- Add link to the performance optimization guide (#13595, @cakrit)
- Update macOS community support details (#13536, @DShreve2)
- Update FreeIPMI and CUPS plugin documentation (#13526, @Ferroin)
- Remove reference to charts now in netdata monitoring (#13521, @andrewm4894)
- Add a note about authorized_mailq_users to postfix readme (#13515, @ilyam8)
- Add a document outlining how to build native packages locally (#12431, @Ferroin)
- Add some tips on collecting per-queue metrics for RabbitMQ (#12227, @HG00)
Health
Engine
- Add support of chart labels in alerts (#13290, @MrZammler)
Notifications
- Add an option to retry on telegram API limit error (#13119, @MAH69IK)
- Set default curl connection timeout if not set (#13529, @ilyam8)
Alarms
- Use 'host' label in alerts info (health.d/ping.conf) (#13955, @ilyam8)
- Remove pihole_blocklist_gravity_file_existence_state (health.d/pihole.conf) (#13826, @ilyam8)
- Fix the systemd_mount_unit_failed_state alarm name (health.d/systemdunits.conf) (#13796, @tkatsoulas)
- Add 1m delay for tcp reset alarms (health.d/tcp_resets.conf) (#13761, @ilyam8)
- Add new Redis alarms (health.d/redis.conf) (#13715, @ilyam8)
- Fix inconsistent alert class names (#13699, @ralphm)
- Disable Postgres last vacuum/analyze alarms (health.d/postgres.conf) (#13698, @ilyam8)
- Add node level AR based example (health.d/ml.conf) (#13684, @andrewm4894)
- Add Postgres alarms (health.d/postgres.conf) (#13671, @ilyam8)
- Adjust systemdunits alarms (health.d/systemdunits.conf) (#13623, @ilyam8)
- Add Postgres total connection utilization alarm (health.d/postgres.conf) (#13620, @ilyam8)
- Adjust mysql_galera_cluster_size_max_2m lookup to make time in warn/crit predictable (health.d/mysql.conf) (#13563, @ilyam8)
Packaging / Installation
Changes
- Fix writing to stdout if static update is successful (#14058, @ilyam8)
- Update go.d.plugin to v0.45.0 (#14052, @ilyam8)
- Provide improved messaging in the kickstart script for existing installs managed by the system package manager (#13947, @Ferroin)
- Add CAP_NET_RAW to go.d.plugin (#13909, @ilyam8)
- Record installation command in telemetry events (#13892, @Ferroin)
- Overhaul generation of distinct-ids for install telemetry events (#13891, @Ferroin)
- Prompt users about updates/claiming on unknown install types (#13890, @Ferroin)
- Fix duplicate error code in kickstart.sh (#13887, @Ferroin)
- Properly guard commands when installing services for offline service managers (#13848, @Ferroin)
- Fix service installation on FreeBSD. (#13842, @Ferroin)
- Improve error and warning messages in the kickstart script (#13825, @Ferroin)
- Properly propagate errors from installer/updater to kickstart script (#13802, @Ferroin)
- Fix runtime directory ownership when installed as non-root user (#13797, @Ferroin)
- Stop pulling in netcat as a mandatory dependency (#13787, @Ferroin)
- Add Ubuntu 22.10 to supported distros, CI, and package builds (#13785, @Ferroin)
- Allow netdata installer to install and run netdata as any user (#13780, @ktsaou)
- Update libbpf to v1.0.1 (#13778, @thiagoftsm)
- Further improvements to the new service installation code (#13774, @Ferroin)
- Use /bin/sh instead of ls to detect glibc (#13758, @MrZammler)
- Add CloudLinux OS detection to the updater script (#13752, @Pulseeey)
- Add CloudLinux OS detection to kickstart (#13750, @Pulseeey)
- Fix handling of temporary directories in kickstart code. (#13744, @Ferroin)
- Fix a typo in netdata-installer.sh (#13514, @uplime)
- Add CAP_NET_ADMIN for go.d.plugin (#13507, @ilyam8)
- Update PIDFile in netdata.service to avoid systemd legacy path warning (#13504, @candrews)
- Overhaul handling of installation of Netdata as a system service. (#13451, @Ferroin)
- Fix existing install detection for FreeBSD and macOS (#13243, @Ferroin)
- Assorted cleanup in the OpenRC init script (#13115, @Ferroin)
Other Notable Changes
⚙️ Greasing the gears to smooth your experience with Netdata.
Improvements
- Add replication of metrics (gaps filling) during streaming (#13873, @vkalintiris)
- Remove anomaly rates chart (#13763, @vkalintiris)
- Add disabling netdata monitoring section of the dashboard (#13788, @ktsaou)
- Add host labels for ephemerality and nodes with unstable connections (#13784, @underhood)
- Allow netdata plugins to expose functions for querying more information about specific charts (#13720, @ktsaou)
- Improve Health engine performance by adding a thread per host (#13712, @MrZammler)
- Improve streaming performance by 25% on the child (#13708, @ktsaou)
- Improve agent shutdown time (#13649, @stelfrag)
- Add disabling Cloud functionality via NETDATA_DISABLE_CLOUD environment variable (#13106, @ilyam8)
-
Bug Fixes
🐞 Increasing Netdata's reliability, one bug fix at a time.
- Fix sanitizing command arguments executed by the health component (#14064, @vkalintiris)
- Fix control of streaming API keys and MACHINE GUIDs in stream.conf (#14063, @ktsaou)
- Fix build on old versions of openssl on Centos (#14045, @underhood)
- Fix merging duplicate replication requests (#14037, @ktsaou)
- Fix various problems in streaming compression, query planner and replication (#14023, @ktsaou)
- Fix ACLK connection resets on parents with a lot of children (#14004, @underhood)
- Fix crash when netdata cannot execute its external plugins (#13978, @ktsaou)
- Fix metrics suffix for counters when using remote write exporter (#13977, @vlvkobal)
- Fix replicating non-existing child host (#13968, @ktsaou)
- Fix local dashboard cloud links (#13953, @underhood)
- Fix stopping Netdata on WSL1 (#13948, @MrZammler)
- Fix negative values when removing a "percentage-of-incremental-row" dimension (#13945, @ktsaou)
- Fix chart definition end time_t printing and parsing (#13942, @ktsaou)
- Fix not using system CA certificates when streaming (#13941, @MrZammler)
- Fix segfault when a dimension is deleted while replicated (#13932, @ktsaou)
- Fix compiling without dbengine (#13931, @ilyam8)
- Fix crash on query plan switch (#13920, @ktsaou)
- Fix crash when free hosts if a change on db mode is not needed (#13912, @ktsaou)
- Fix timeframe matching in query engine (#13911, @ktsaou)
- Fix reading health "enable" from the configuration (#13894, @stelfrag)
- Fix segmentation fault on 32-bit RPi (#13876, @MrZammler)
- Fix ml_info call via ACLK (#13863, @underhood)
- Fix compiling with LTO enabled on FreeBSD (#13854, @MrZammler)
- Fix tiers update frequency (#13844, @ktsaou)
- Fix crash on child reconnect and lost metrics (#13821, @stelfrag)
- Fix post-processing of contexts (#13807, @ktsaou)
- Fix initialization of chart variables (#13795, @MrZammler)
- Fix Array Allocator memory leak(#13792, @ktsaou)
- Fix chart variables initialization (#13786, @MrZammler)
- Fix compilation on CentOS 7.9 (#13775, @thiagoftsm)
- Fix count of currently streaming senders on the localhost (#13755, @MrZammler)
- Fix streaming crash when child reconnects and is archived on the parent (#13754, @stelfrag)
- Fix sending NodeInfo during first database cleanup (#13740, @MrZammler)
- Fix starting an archived host in dbengine if dbengine is not compiled (#13724, @stelfrag)
- Fix building judy without dbengine (#13703, @underhood)
- fix typo not deleting collected flag; force removing collected flag on child disconnect (#13672, @ktsaou)
- Fix access to old data when nmap is used (#13666, @stelfrag)
- Fix container virtualization info detection (#13653, @vlvkobal)
- Fix rrdcontexts left in the post-processing queue from the garbage collector (#13645, @ktsaou)
- Fix a memory leak on archived host creation (#13641, @stelfrag)
- Fix worker utilization cleanup (#13633, @stelfrag)
- Fix loading db rows when chart_id or dim_id is null (#13608, @MrZammler)
- Fix crash on rrdcontext apis when rrdcontexts is not initialized (#13578, @ktsaou)
- Fix a failure to build eBPF with CMake (#13568, @underhood)
- Fix a crash when xen libraries are misconfigured (#13535, @vlvkobal)
- Fix crashes on 32bit system (#13511, @MrZammler)
Code organization
Changes
- Replication fixes 8 (#14061, @ktsaou)
- Replication fixes 7 (#14053, @ktsaou)
- Remove eBPF plugin warning (#14047, @thiagoftsm)
- Replication fixes 6 (#14046, @ktsaou)
- Fix dictionaries unittest (#14042, @ktsaou)
- Improve log message in case of ACLK SSL error (#14041, @underhood)
- Replication fixes 5 (#14038, @ktsaou)
- Replication fixes 3 (#14035, @ktsaou)
- Improve performance of worker utilization statistics (#14034, @ktsaou)
- Use 2 levels of judy arrays to speed up replication on very busy parents (#14031, @ktsaou)
- Remove retries from SSL (#14026, @ktsaou)
- Silence misleading error on ACLK startup (#14013, @underhood)
- Change static image urls to app.netdata.cloud in alarm-notify.sh (#14007, @MrZammler)
- Fix MQTT-NG QoS0 (#13997, @underhood)
- Add 'funcs' capability (#13992, @underhood)
- Add debug info on left-over query targets (#13990, @ktsaou)
- Replication improvements (#13989, @ktsaou)
- Remove spaces from keys in processes output of apps.plugin functions (#13980, @ktsaou)
- Prohibit using spaces in apps.plugin function processes keys (#13980, @ktsaou)
- Fallback to ar and ranlib if llvm-ar and llvm-ranlib are not there (#13959, @MrZammler)
- Require -DENABLE_DLSYM=1 to use dlsym() (#13958, @ktsaou)
- Do not resend charts upstream when chart variables are being updated (#13946, @ktsaou)
- Update print message on startup (#13934, @andrewm4894)
- Remove pluginsd action param & dead code (#13928, @vkalintiris)
- Do not force internal collectors to call rrdset_next (#13926, @vkalintiris)
- Return accidentaly removed 32bit RPi keep alive fix (#13925, @underhood)
- Add error_limit() function to limit number of error lines per instance (#13924, @ktsaou)
- Enable aclk conversation log even without NETDATA_INTERNAL CHECKS (#13917, @MrZammler)
- Add max value on all value columns for apps.plugin function (#13899, @ktsaou)
- Reduce unnecessary alert events to the cloud (#13897, @MrZammler)
- Tune rrdcontext timings (#13889, @ktsaou)
- Add filtering charts in context queries, includes them in full_xxx variables (#13886, @ktsaou)
- Cosmetic changes for apps.plugin function processes (#13880, @ktsaou)
- Allow single chart to be filtered in context queries (#13879, @ktsaou)
- Suppress ML and dlib ABI warnings (#13875, @Dim-P)
- Don't create a REMOVED alert event after a REMOVED (#13871, @MrZammler)
- Store hidden status when creating / updating dimension metadata (#13869, @stelfrag)
- Find the chart and dimension UUID from the context (#13868, @stelfrag)
- Change all api accesses to api.netdata.cloud (#13856, @underhood)
- Use mmap to read an extent from a datafile (#13834, @stelfrag)
- Remove option to use MQTT 3 (#13824, @underhood)
- Extended processes function info from apps.plugin (#13822, @ktsaou)
- Add trace alloc to buildinfo (#13817, @underhood)
- Inject costallocz to mqtt_websockets library and its children (#13813, @underhood)
- Overload libc memory allocators with custom ones to trace all allocations (#13810, @ktsaou)
- Fix warning when -Wfree-nonheap-object is used (#13805, @underhood)
- Optimize ARAL alloc size (#13804, @ktsaou)
- Add internal log error, when passing NULL dictionary (#13803, @ktsaou)
- Return memory freed properly (#13799, @stelfrag)
- Use string_freez instead of freez in rrdhost_init_timezone (#13798, @MrZammler)
- Add variants of functions allowing callers to specify the time to use. (#13791, @vkalintiris)
- Remove extern from function declared in headers. (#13790, @vkalintiris)
- Full memory tracking and profiling of Netdata Agent (#13789, @ktsaou)
- Add a thread to asynchronously process metadata updates (#13783, @stelfrag)
- Parser cleanup (#13782, @stelfrag)
- Bump websockets submodule (#13776, @underhood)
- Make dbengine free from RRDSET and RRDDIM (#13772, @ktsaou)
- Add possibility to build without ACLK with CMake (#13736, @underhood)
- Fix coverity warnings (#13735, @thiagoftsm)
- Do not create train/predict dimensions meant for tracking anomaly rates. (#13707, @vkalintiris)
- Update exporting unit tests (#13706, @vlvkobal)
- Add new query engine for Netdata Agent (QUERY_TARGET) (#13697, @ktsaou)
- Use CMake generated config.h also in out of tree CMake build (#13692, @underhood)
- Store nulls instead of empty strings in health tables (#13683, @MrZammler)
- Fix warnings during compilation time on ARM (32 bits) (#13681, @thiagoftsm)
- Disable internal log (#13678, @ktsaou)
- Remove _instance_family label (#13674, @ilyam8)
- Additional sqlite statistics (#13668, @stelfrag)
- Add sqlite page cache hits and miss statistics (#13665, @stelfrag)
- Use mmap if possible during startup for journal replay (#13660, @stelfrag)
- Remove anomaly detector (#13657, @vkalintiris)
- Do not free AR dimensions from within ML. (#13651, @vkalintiris)
- Remove Chart/Dim based communication (#13650, @underhood)
- Add RRD structures managed by dictionaries (#13646, @ktsaou)
- Fix compilation issues (#13640, @ktsaou)
- Obsolete RRDSET state (#13635, @ktsaou)
- Remove forgotten avl structure from rrdcalc (#13632, @ktsaou)
- Improve rrdcontext performance (#13629, @ktsaou)
- Clean chart hash map (#13611, @stelfrag)
- Use prepared statements for context related queries (#13602, @stelfrag)
- Add sqlite3 global statistics (#13594, @ktsaou)
- Various CMake improvements (#13575, @underhood)
- Deduplicate all netdata strings (#13570, @ktsaou)
- Removing logging that a chart collection in the same interpolation point (#13567, @ilyam8)
- Prefer context attributes from non archived charts (#13559, @MrZammler)
- Fix coverity 380387 (#13551, @MrZammler)
- Remove aclk_api.ch (#13540, @underhood)
- Cleanup of APIs (#13539, @underhood)
- Schedule next rotation based on absolute time (#13531, @MrZammler)
- Calculate name hash after rrdvar_fix_name (#13509, @MrZammler)
- Reduce memcpy and memory usage on mqtt5 (#13450, @underhood)
- Specify paths to source files for out-of-tree build (#11475, @KickerTom)
Deprecation and product notices
Forthcoming deprecation notice
The following items will be removed in our next minor release (v1.38.0):
Patch releases (if any) will not be affected.
| Component | Type | Will be replaced by |
|---|---|---|
| python.d/dockerd | collector | go.d/docker |
| python.d/logind | collector | go.d/logind |
| python.d/mongodb | collector | go.d/mongodb |
| fping | collector | go.d/ping |
All the deprecated components will be moved to the netdata/community repository.
Deprecated in this release
In accordance with our previous deprecation notice, the following items have been removed in this release:
| Component | Type | Replaced by |
|---|---|---|
| python.d/postgres | collector | go.d/postgres |
Notable changes and suggested actions
Kickstart unrecognized option error
In an effort to improve our kickstart script even more, documented here and here, a change will be made in the next major release that will result in users receiving an error if they pass an unrecognized option, rather than allowing them to pass through the installer code.
New documentation structure
In the coming weeks, we will be introducing a new structure to Netdata Learn. Part of this effort includes having healthy redirects, instructions, and landing pages to minimize confusion and lost bookmarks, but users may still encounter broken links or errors when loading moved or deleted pages. Users can feel free to submit a Github Issues if they encounter such a problem, or reach out to the Netdata Documentation Team with questions or ideas on how our docs can best serve you.
External plugin packaging (Possible action required)
In a forthcoming release, many external plugins will be moved to their own packages in our native packages to allow enhanced control over what plugins you have installed, to preserve bandwidth when updating, and to avoid some potentially undesirable dependencies. As a result of this, at some point during the lead-up to the next minor release, the following plugins will no longer be installed by default on systems using native packages, and users with any of these plugins on an existing install will need to manually install the packages in order to continue using them:
- nfacct
- ioping
- slabinfo
- perf
- charts.d
Note: Static builds and locally built installations are unaffected. Netdata will provide more details once the changes go live.
Netdata Release Meetup
Join the Netdata team on the 1st of December, at 5PM UTC, for the Netdata Release Meetup, which will be held on
the Netdata Discord.
Together we’ll cover:
- Release Highlights
- Acknowledgements
- Q&A with the community
RSVP now - we look forward to meeting you.
Support options
As we grow, we stay committed to providing the best support ever seen from an open-source solution. Should you encounter
an issue with any of the changes made in this release or any feature in Netdata, feel free to contact us through one of the following channels:
Netdata Learn: Find documentation, guides, and reference material for monitoring and troubleshooting your systems with Netdata.
GitHub Issues: Make use of the Netdata repository to report bugs or open a new feature request.
GitHub Discussions: Join the conversation around the Netdata development process and be a part of it.
Community Forums: Visit the Community Forums and contribute to the collaborative knowledge base.
Discord: Jump into the Netdata Discord and hangout with like-minded sysadmins, DevOps, SREs and other troubleshooters. More than 1300 engineers are already using it!
Published by netdatabot about 2 years ago
Release v1.36.1
Netdata v1.36.1 is a patch release to address two issues discovered since v1.36.0. Refer to the v.1.36.0 release notes for the full scope of that release.
The v1.36.1 patch release fixes the following:
- An issue that could cause agents running on 32bit distributions to crash during data exchange with the cloud (PR #13511).
- An issue with the handling of the Go plugin in the installer code that prevented the new WireGuard collector from working without user intervention (PR # 13507).
Support options
As we grow, we stay committed to providing the best support ever seen from an open-source solution. Should you encounter
an issue with any of the changes made in this release or any feature in the Netdata Agent, feel free to contact us
through one of the following channels:
-
Netdata Learn: Find documentation, guides, and reference material for monitoring and
troubleshooting your systems with Netdata. -
Github Issues: Make use of the Netdata repository to report bugs or open
a new feature request. -
Github Discussions: Join the conversation around the Netdata
development process and be a part of it. -
Community Forums: Visit the Community Forums and contribute to the collaborative
knowledge base. -
Discord: Jump into the Netdata Discord and hangout with like-minded sysadmins,
DevOps, SREs and other troubleshooters. More than 1100 engineers are already using it!
Published by netdatabot about 2 years ago
Release v1.36
Table of contents
- Release highlights
- Acknowledgments
- Contributions
- Deprecation notice
- Netdata Release Meetup
- Support options
❗ We're keeping our codebase healthy by removing features that are end of life. Read the deprecation notice to check if you are affected.
Netdata open-source growth
- 7.6M+ troubleshooters monitor with Netdata
- 1.6M unique nodes currently live
- 3.3k+ new nodes per day
- Over 557M Docker pulls all-time total
- Over 60,000 stargazers on GitHub
Release highlights
Metric correlations
New metric correlation algorithm (tech preview)
The Agent's default algorithm to run a metric correlations job (ks2) is based on Kolmogorov-Smirnov test. In this release, we also included the Volume algorithm, which is an heuristic algorithm based on the percentage change in averages between the highlighted window and a baseline, where various edge cases are sensibly controlled. You can explore our implementation in the Agent's source code
This algorithm is almost 73 times faster than the default algorithm (named ks2) with near the same accuracy. Give it a try by enabling it by default in your netdata.conf.
[global]
   # enable metric correlations = yes
   metric correlations method = volume
Cooperation of the Metric Correlations (MC) component with the Anomaly Advisor
The Anomaly Advisor feature lets you quickly surface potentially anomalous metrics and charts related to a particular highlight window of interest. When the Agent trains its internal Machine Learning models, it produces an Anomaly Rate for each metric.
With this release, Netdata can now perform Metric Correlation jobs based on these Anomalous Rate values for your metrics.
Metric correlations dashboard
In the past, you used to run MC jobs from the Node's dashboard with all the settings predefined. Now, Netdata gives you some extra functionality to run an MC job for a window of interest with the following options:
- To run an MC job on both Metrics and their Anomaly Rate
- To change the aggregation method of datapoints for the metrics.
- To choose between different algorithms
All this from the same, single dashboard.

What's next with Metric Correlations
Troubleshooting complicated infrastructures can get increasingly hard, but Netdata wants to continually provide you with the best troubleshooting experience. On that note, here are some next logical steps for for our Metric Correlations feature, planned for upcoming releases:
- Enriching the Agent with more Metric Correlation algorithms.
- Making the Metric Correlation component run seamless (you can explore the
/weightsendpoint in the Agent's API; this is a WIP). - Giving you the ability to run Metric Correlation Jobs across multiple nodes.
Be on the lookout for these upgrades and feel free to reach us in our channels with your ideas.
Tiering, providing almost unlimited metrics for your nodes
Netdata is a high fidelity monitoring solution. That comes with a cost, the cost of keeping those data in your disks. To help remedy this cost issue, Netdata introduces with this release the Tiering mechanism for the Agent's time-series database (dbengine).
Tiering is the mechanism of providing multiple tiers of data with different granularity on metrics by doing the following:
- Downsampling the data into lower resolution data.
- Keeping statistical information about the metrics to recreate the original* metrics.
Visit the Tiering in a nutshell section in our docs to understand the maximum potential of this feature. Also, don't hesitate to enable this feature to change the retention of your metrics
Note: *Of course the metric may vary; you can just recreate the exact time series without taking into consideration other parameters.
Kubernetes
A Kubernetes Cluster can easily have hundreds (or even thousands) of pods running containers. Netdata is now able to provide you with an overview of the workloads and the nodes of your Cluster. Explore the full capabilities of the k8s_state module
Anomaly Rate on every chart
In a previous release, we introduced unsupervised ML & Anomaly Detection in Netdata with Anomaly Advisor. With this next step, we’re bringing anomaly rates to every chart in Netdata Cloud. Anomaly information is no longer limited to the Anomalies tab and will be accessible to you from the Overview and Single Node view tabs as well. We hope this will make your troubleshooting journey easier, as you will have the anomaly rates for any metric available with a single click, whichever metric or chart you happen to be exploring at that instant.
If you are looking at a particular metric in the overview or single node dashboard and are wondering if the metric was truly anomalous or not, you can now confirm or disprove that feeling by clicking on the anomaly icon and expanding the anomaly rate view. Anomaly rates are calculated per second based on ML models that are trained every hour.

For more details please check our blog post and video walkthrough.
Centralized Admin Interface & Bulk deletion of offline nodes
We've listened and understood the your pain around Space and War Room settings in Netdata Cloud. In response, we have simplified and organized these settings into a Centralized Administration Interface!
In a single place, you're now able to access and change attributes around:
- Space
- War Rooms
- Nodes
- Users
- Notifications
- Bookmarks

Along with this change, the deletion of individual offline nodes has been greatly improved. You can now access the Space settings, and on Nodes within which it is possible to filter all Offline nodes, you can now mass select and bulk delete them.
Agent and Cloud chart metadata syncing
On this release, we are doing a major improvement on our chart metadata syncing protocol. We moved from a very granular message exchange at chart dimension level to a higher level at context.
This approach will allow us to decrease the complexity and points of failure on this flow, since we reduced the number of events being exchanged and scenarios that need to be dealt with. We will continuously fix complex and hard-to-track existing bugs and any potential unknown ones.
This will also bring a lot of benefits to data transfer between Agents to Cloud, since we reduced the number of messages being transmitted.
To sum up these changes:
- The traffic between Netdata cloud and Agents is reduced significantly.
- Netdata Cloud scales smoother with hundreds of nodes.
- Netdata Cloud is aware of charts and nodes metadata.
Visualization improvements
Composite chart enhancements
We have restructured composite charts into a more natural presentation. You can now read composite charts as if reading a simple sentence, and make better sense of how and what queries are being triggered.
In addition to this, we've added additional control over time aggregations. You can now instruct the agent nodes on what type of aggregation you want to apply when multiple points are grouped into a single one.
The options available are: min, max, average, sum, incremental sum (delta), standard deviation, coefficient of variation, media, exponential weighted moving average and double exponential smoothing.

Theme restyling
We've also put some effort to improve our light and dark themes. The focus was put on:
- optimizing space for the information that is crucial to you when you're exploring and/or troubleshooting your nodes.
- improving contrast ratios so that the components and data that are more relevant don't get lost among other noise.

Labels on every chart
Most of the time, you will group metrics by their dimension or their instance, but there are some benefits to other groupings. So, you can now group them by logical representations.
For instance, you can represent the traffic in your network interfaces by their interface type, virtual or physical.

This is still a work in progress, but you can explore the newly added labels on the following areas/charts:
- Disks
- Mountpoints in your system
- Network interfaces both wired and wireless
- MD arrays
- Power supply units
- Filesystem (like BTRFS)
Acknowledgments
We would like to thank our dedicated, talented contributors that make up this amazing community. The time and expertise that you volunteer is essential to our success. We thank you and look forward to continue to grow together to build a remarkable product.
- @didier13150 for fixing boolean value for ProtectControlGroups in the systemd unit file.
- @kklionz for fixing a base64_encode bug in Exporting Engine.
- @kralewitz for fix parsing multiple values in nginx upstream_response_time in go.d/web_log.
- @mhkarimi1383 for adding an alternative way to get ansible plays to Ansible quickstart.
- @tnyeanderson for fixing netdata-updater.sh sha256sum on BSDs.
- @xkisu for fixing cgroup name detection for docker containers in containerd cgroup.
- @boxjan for adding Chrony collector.
Contributions
Collectors
New
⚙️ Enhancing our collectors to collect all the data you need.
- Add PgBouncer collector (go.d/pgbouncer) (#748, @ilyam8)
- Add WireGuard collector (go.d/wireguard) (#744, @ilyam8)
- Add PostgresSQL collector (go.d/postgres) (#718, @ilyam8)
- Add Chrony collector (go.d/chrony) (#678, @boxjan)
- Add Kubernetes State collector (go.d/k8s_state) (#673, @ilyam8)
Improvements
⚙️ Enhancing our collectors to collect all the data you need.
- Add WireGuard description and icon to dashboard info (#13483, @ilyam8)
- Resolve nomad containers name (cgroups.plugin) (#13481, @ilyam8)
- Update postgres dashboard info (#13474, @ilyam8)
- Improve Chrony dashboard info (#13371, @ilyam8)
- Improve config file parsing error message (python.d) (#13363, @ilyam8)
- Rename the chart of real memory usage in FreeBSD (freebsd.plugin) (#13271, @vlvkobal)
- Add fstype label to disk charts (diskspace.plugin) (#13245, @vlvkobal)
- Add support for loadin modules from user plugin directories (python.d) (#13214, @ilyam8)
- Add user plugin dirs to environment variables (#13203, @vlvkobal)
- Add second data collection job that tries to read from '/var/lib/smartmontools/' (python.d/smartd) (#13188, @ilyam8)
- Add type label for network interfaces (proc.plugin) (#13187, @vlvkobal)
- Add k8s_state dashboard_info (#13181, @ilyam8)
- Add dimension per physical link state to the "Interface Physical Link State" chart (proc.plugin) (#13176, @ilyam8)
- Add dimension per operational state to the "Interface Operational State" chart (proc.plugin) (#13167, @ilyam8)
- Add dimension per duplex state to the "Interface Duplex State" chart (proc.plugin) (#13165, @ilyam8)
- Add cargo/rustc/bazel/buck to apps_groups.conf (apps.plugin) (#13143, @vkalintiris)
- Add Memory Available chart to FreeBSD (freebsd.plugin) (#13140, @MrZammler)
- Add a separate thread for slow mountpoints in the diskspace plugin (diskspace.plugin) (#13067, @vlvkobal)
- Add simple dimension algorithm guess logic when algorithm is not set (go.d/snmp) (#737, @ilyam8)
- Add common stub_status locations (go.d/nginx) (#702, @cpipilas)
Bug fixes
🐞 Improving our collectors one bug fix at a time.
- Fix cgroup name detection for docker containers in containerd cgroup (cgroups.plugin) (#13470, @xkisu)
- Fix not handling log rotation (python.d/smartd) (#13460, @ilyam8)
- Fix kubepods patterns to filter pods when using Kind cluster (cgroups.plugin) (#13324, @ilyam8)
- Fix 'zmstat*' pattern to exclude zoneminder scripts (apps.plugin) (#13314, @ilyam8)
- Fix kubepods name resolution in a kind cluster (cgroups.plugin) (#13302, @ilyam8)
- Fix extensive error logging (cgroups.plugin) (#13274, @vlvkobal)
- Fix qemu VMs and LXC containers name resolution (cgroups.plugin) (#13220, @ilyam8)
- Fix duplicate mountinfo (proc.plugin) (#13215, @ktsaou)
- Fix removing netdev chart labels (cgroups.plugin) (#13200, @vlvkobal)
- Fix wired/cached/avail memory calculation on FreeBSD with ZFS (freebsd.plugin) (#13183, @ilyam8)
- Fix import collection for py3.10+ (python.d) (#13136, @ilyam8)
- Fix not setting connection timeout for pymongo4+ (python.d/mongodb) (#13135, @ilyam8)
- Fix not handling slow setting spec.NodeName for Pods (go.d/k8s_state) (#717, @ilyam8)
- Fix empty charts when ServerMPM is prefork (#715, @ilyam8)
- Fix parsing multiple values in nginx upstream_response_time (go.d/web_log) (#711, @kralewitz)
- Fix collecting metrics for Nodes with dots in name (go.d/k8s_state) (#710, @ilyam8)
- Fix adding dimensions to User CPU Time chart at runtime (go.d/mysql) (#689, @ilyam8)
eBPF
- Fix data collection frequency (#13351, @thiagoftsm)
- Fix crash on cleanup (#13259, @thiagoftsm)
Exporting
- Fix a base64_encode bug (#13074, @kklionz)
- Fix sent metrics calculation (#13435, @vlvkobal)
- Move host tags to netdata_info (#13358, @vlvkobal)
- Fix exporting to OpenTSDB (#13355, @vlvkobal)
- Fix exporting to Graphite (#13261, @vlvkobal)
- Add exporting chart variables (#13221, @boxjan)
Documentation
📄 Keeping our documentation healthy together with our awesome community.
- Add a note about network interface monitoring when running in a Docker container (#13458, @ilyam8)
- Fix Anomaly Detection guide, so we can reference its subsections (#13455, @tkatsoulas)
- Fix a typo in PostgreSQL section header (#13440, @shyamvalsan)
- Add Discord, YouTube, LinkedIn links to README (#13419, @andrewm4894)
- Add ML bullet point to features section on README (#13418, @andrewm4894)
- Fix docs metadata fields (#13406, @tkatsoulas)
- Clarify python.d haproxy module readme (#13388, @ilyam8)
- Add missing openSUSE 15.4 to platform support list. (#13373, @Ferroin)
- Add another way to get ansible plays to Ansible quickstart (#13349, @mhkarimi1383)
- Add GitHub stars badge to readme (#13338, @andrewm4894)
- Explain new tiering mechanism in metric storage docs (#13327, @tkatsoulas)
- Add link to docker config section (#13323 , @cakrit)
- Add a guide for troubleshooting Agent with Cloud connection for new nodes (#13322, @Ancairon)
- Update External Plugins API doc (#13273, @thiagoftsm)
- Update REST API documentation. (#13269, @Ferroin)
- Add document explaining how to proxy Netdata via H2O (#13266, @Ferroin)
- Improve anomaly detection guide (#13238, @andrewm4894)
- Improve configuration example in ML readme (#13182, @andrewm4894)
- Docs housekeeping (#13179, @tkatsoulas)
- Add ML alerts examples (#13173, @andrewm4894)
- Improve "if collector not there" section in Collectors readme (#13152, @cakrit)
- Fix indentation in StatsD readme (#13096, @ilyam8)
- Add missing commands to daemon readme (#13080, @tkatsoulas)
Packaging / Installation
📦 "Handle with care" - Just like handling physical packages, we put in a lot of care and effort to publish beautiful software packages.
- Update go.d.plugin version to v0.34.0 (#13484, @ilyam8)
- Fix netdata-updater.sh sha256sum on BSDs (#13391, @tnyeanderson)
- Add Oracle Linux 9 to officially supported platforms (#13367, @Ferroin)
- Vendor Judy (#13362, @underhood)
- Add additional Docker image build with debug info included (#13359, @Ferroin)
- Fix not respecting CFLAGS arg when building Docker image (#13340, @ilyam8)
- Remove python-mysql from install-required-packages.sh (#13288, @ilyam8)
- Remove obsolete --use-system-lws option from netdata-installer.sh help (#13272, @Dim-P)
- Fix issues with DEB postinstall script (#13252, @Ferroin)
- Don’t pull in GCC for build if Clang is already present. (#13244, @Ferroin)
- Upload packages to new self-hosted repository infrastructure (#13240, @Ferroin)
- Bump repoconfig package version used in kickstart.sh (#13235, @Ferroin)
- Properly handle interactivity in the updater code (#13209, @Ferroin)
- Don’t use realpath to find kickstart source path (#13208, @Ferroin)
- Ensure tmpdir is set for every function that uses it (#13206, @Ferroin)
- Add netdata user to secondary group in RPM package (#13197, @iigorkarpov)
- Remove a call to 'cleanup_old_netdata_updater()' because it is no longer exists (#13189, @ilyam8)
- Don’t manipulate positional parameters in DEB postinst script (#13169, @Ferroin)
- Add CAP_SYS_RAWIO to Netdata's systemd unit CapabilityBoundingSet (#13154, @ilyam8)
- Add netdata user to secondary group in DEB package (#13109, @iigorkarpov)
- Fix updating when using
--force-updateand new version of the updater script is available (#13104, @ilyam8) - Remove unnecessary ‘cleanup’ code (#13103, @Ferroin)
- Remove official support for Debian 9. (#13065, @Ferroin)
- Add openSUSE Leap 15.4 to CI and package builds. (#12270, @Ferroin)
- Fix boolean value for ProtectControlGroups in the systemd unit file (#11281, @didier13150)
Other Notable Changes
Improvements
⚙️ Greasing the gears to smoothen your experience with Netdata.
- Enable rrdcontexts by default (#13471, @stelfrag)
- Add rrdcontext support for hidden charts (#13466, @ktsaou)
- Load host labels for archived hosts (#13464, @stelfrag)
- Add /api/v1/weights endpoint (#13449, @ktsaou)
- Add stats about currently collected metrics and disk space to tiering endpoint (#13445, @ktsaou)
- Show last 15 alerts in notification (#13434, @MrZammler)
- Add tiering statistics API endpoint (#13420, @ktsaou)
- Send chart context with alert events to the cloud (#13409, @MrZammler)
- Send node info message sooner (#13348, @MrZammler)
- Use new MQTT as default (#13287, @underhood)
- Better ACLK debug communication log (#13281, @underhood)
- Add Multi-Tier database backend for long term metrics storage (#13263, @stelfrag)
- Add natural and virtual points support to Query Engine (#13248, @ktsaou)
- Delay health until obsoletions check is complete (#13239, @MrZammler)
- Enable ML by default (#13158, @andrewm4894)
- Add multi-granularity support to Query Engine and MC improvements (#13155, @ktsaou)
- Add an option to use malloc for page cache instead of mmap (#13142, @stelfrag)
- Significantly improve metrics correlations (73x times faster) (#13107, @ktsaou)
- Add SSL received/send bytes statistics to ACLK (#13091, @underhood)
Bug fixes
🐞 Increasing Netdata's reliability one bug fix at a time.
- Fix crash on Agent startup if data rotation needs to be done (#13473, @stelfrag)
- Fix agent crash when archived host has not been registered to the cloud (#13437, @stelfrag)
- Fix gap filling on dbengine gaps (#13417, @MrZammler)
- Fix 32bit calculation on array allocator (#13343, @ktsaou)
- Fix crash on start on slow disks because ml is initialized before dbengine starts (#13342, @ktsaou)
- Fix crash when the host_labels health line contains the name/value of a label that does not exist on the host (#13305, @MrZammler)
- Fix incorrect dimension names in Redis alarms (#13296, @ilyam8)
- Fix Query Engine alignment (#13282, @ktsaou)
- Fix vbi parser in mqtt5 implementation (#13277, @underhood)
- Fix alignment in charts endpoint (#13275, @thiagoftsm)
- Fix RAM calculation on macOS in system-info (#13260, @ilyam8)
- Fix data query on stale chart (#13159, @stelfrag)
- Fix crashes due to misaligned allocations (#13137, @ktsaou)
- Fix buffer overflow detected by the compiler (#13120, @ktsaou)
- Fix 100% CPU when using SSL and a child disconnect from a parent (#13112, @thiagoftsm)
- Fix virtualization detection on FreeBSD (#13087, @ilyam8)
Code organization
🏋️ Changes to keep our code base in good shape.
- Handle cases where entries where stored as text (with strftime("%s")) (#13472, @stelfrag)
- Get last_entry_t only when st changes (#13448, @MrZammler)
- Store host label information in the metadata database (#13441, @stelfrag)
- Fix tests so that the actual metadata database is not accessed (#13439, @stelfrag)
- Delete aclk_alert table on start streaming from seq 1 batch 1 (#13438, @MrZammler)
- Query queue only for queries (#13431, @underhood)
- Add missing comma (handle coverity warning CID 379360) (#13413, @stelfrag)
- Remove python.d/web_log alarms (#13404, @ilyam8)
- Store host system information in the database (#13402, @stelfrag)
- Fix coverity issue 379240 (Unchecked return value) (#13401, @stelfrag)
- Fix bitmap unit tests (#13374, @stelfrag)
- Remove python.d collectors announced in v1.35.0 deprecation notice (#13370, @ilyam8)
- Address Coverity issues (#13364, @stelfrag)
- Omit first point if not needed in Query Engine (#13345, @ktsaou)
- Fix coverity 379241 (#13336, @MrZammler)
- Add Rrdcontext in memory indexing (#13335, @ktsaou)
- Detect stored metric size by page type (#13334, @stelfrag)
- Silence compile warnings on external source (#13332, @MrZammler)
- Add UpdateNodeCollectors message (#13330, @MrZammler)
- Fix Cid 379238 379238 (#13328, @stelfrag)
- Fix two helgrind reports (#13325, @vkalintiris)
- Add array allocator for dbengine page descriptors (#13312, @ktsaou)
- Protect shared variables with log lock. (#13306, @vkalintiris)
- Null terminate string if file read was not successful (#13299, @stelfrag)
- Remove deprecated modules from python.d.conf (#13264, @ilyam8)
- Remove warnings while compiling ML on FreeBSD (#13255, @thiagoftsm)
- Remove strftime from statements and use unixepoch instead (#13250, @stelfrag)
- Updates the sqlite version in the agent (#13233, @stelfrag)
- Migrate data when machine GUID changes (#13232, @stelfrag)
- Add more sqlite unittests (#13227, @stelfrag)
- Add Netdata doubles (#13217, @ktsaou)
- Print INTERNAL BUG messages only when NETDATA_INTERNAL_CHECKS is enabled (#13207, @MrZammler)
- Add hostname in the worker structure to avoid constant lookups (#13199, @stelfrag)
- Allow for an easy way to do metadata migrations (#13196, @stelfrag)
- Add dictionaries with reference counters and full deletion support during traversal (#13195, @ktsaou)
- Add configuration for dbengine page fetch timeout and retry count (#13194, @stelfrag)
- Clean sqlite prepared statements on thread shutdown (#13193, @stelfrag)
- Set default for
minimum num samples to trainto900(#13174, @andrewm4894) - Remove warnings when openssl 3 is used. (#13170, @thiagoftsm)
- Fix coverity issues (#13168, @stelfrag)
- Allow traversing null-value dictionaries (#13162, @ktsaou)
- Use memset to mark the empty words in the quoted_strings_splitter function (#13161, @stelfrag)
- Fix labels unit test (#13156, @stelfrag)
- Use ks2 as MC default (#13131, @andrewm4894)
- Allow label names to have slashes (#13125 , @ktsaou)
- Fix coveriry 379136 379135 379134 379133 (#13123, @ktsaou)
- Removes Legacy JSON Cloud Protocol Support In Agent (#13111, @underhood)
- Add labels with dictionary (#13070, @ktsaou)
- Fix coverity 378587 (#13024, @MrZammler)
Deprecation notice
The following items will be removed in our next minor release (v1.37.0):
Patch releases (if any) will not be affected.
| Component | Type | Will be replaced by |
|---|---|---|
| python.d/postgres | collector | go.d/postgres |
All the deprecated components will be moved to the netdata/community repository.
Deprecated in this release
In accordance with our previous deprecation notice, the following items have been removed in this release:
| Component | Type | Replaced by |
|---|---|---|
| python.d/chrony | collector | go.d/chrony |
| python.d/ovpn_status_log | collector | go.d/openvpn_status_log |
Netdata Release Meetup
Join the Netdata team on the 11th of August for the Netdata Agent Release Meetup, which will be held on the Netdata Discord.
Together we’ll cover:
- Release Highlights
- Acknowledgements
- Q&A with the community
We look forward to meeting you.
Support options
As we grow, we stay committed to providing the best support ever seen from an open-source solution. Should you encounter an issue with any of the changes made in this release or any feature in the Netdata Agent, feel free to contact us through one of the following channels:
- Netdata Learn: Find documentation, guides, and reference material for monitoring and troubleshooting your systems with Netdata.
- Github Issues: Make use of the Netdata repository to report bugs or open a new feature request.
- Github Discussions: Join the conversation around the Netdata development process and be a part of it.
- Community Forums: Visit the Community Forums and contribute to the collaborative knowledge base.
- Discord: Jump into the Netdata Discord and hangout with like-minded sysadmins, DevOps, SREs and other troubleshooters. More than 1100 engineers are already using it!
Published by netdatabot over 2 years ago
Netdata v1.35.1 is a patch release to address issues discovered since v1.35.0. Refer to the v.1.35.0 release notes for the full scope of that release.
The v1.35.1 patch release fixes an issue in the static build installation code that causes automatic updates to be unintentionally disabled when updating static installs.
If you have installed Netdata using a static build since 2022-03-22 and you did not explicitly disable automatic updates, you are probably affected by this bug.
For more details, including info on how to re-enable automatic updates if you are affected, refer to this Github issue.
Support options
As we grow, we stay committed to providing the best support ever seen from an open-source solution. Should you encounter
an issue with any of the changes made in this release or any feature in the Netdata Agent, feel free to contact us
through one of the following channels:
-
Netdata Learn: Find documentation, guides, and reference material for monitoring and
troubleshooting your systems with Netdata. -
Github Issues: Make use of the Netdata repository to report bugs or open
a new feature request. -
Github Discussions: Join the conversation around the Netdata
development process and be a part of it. -
Community Forums: Visit the Community Forums and contribute to the collaborative
knowledge base. -
Discord: Jump into the Netdata Discord and hangout with like-minded sysadmins,
DevOps, SREs and other troubleshooters. More than 1100 engineers are already using it!
Published by Ferroin over 2 years ago
Table of contents
- Release highlights
- Acknowledgments
- Contributions
- Deprecation notice
- Netdata Agent release meetup
- Support options
❗ We're keeping our codebase healthy by removing features that are end of life. Read the deprecation notice to check if you are affected.
Netdata open-source Agent statistics
- 7.6M+ troubleshooters monitor with Netdata
- 1.3M+ unique nodes currently live
- 3.3k+ new nodes per day
- Over 556M Docker pulls all-time total
Release highlights
Anomaly Advisor & on-device Machine Learning
We are excited to launch one of our flagship machine learning (ML) assisted troubleshooting features in Netdata: the Anomaly Advisor.
Netdata now comes with on-device ML! Unsupervised ML models are trained for every metric, at the edge (on your devices), enabling real time anomaly detection across your infrastructure.

This feature is part of a broader philosophy we have at Netdata when it comes to how we can leverage ML-based solutions to help augment and assist traditional troubleshooting workflows, without having to centralize all your data.
The new Anomalies tab quickly lets you find periods of time with elevated anomaly rates across all of your nodes. Once you highlight a period of interest, Netdata will generate a ranked list of the most anomalous metrics across all nodes in the highlighted timeframe. The goal is to quickly let you find periods of abnormal activity in your infrastructure and bring to your attention the metrics that were most anomalous during that time.
In our latest release, we improved the usability of Anomaly Advisor and also ensured that the anomalous metrics are always relevant to the time period you are investigating.
A great deal of care has gone into ensuring that ML running on your device is as light weight in terms of resource consumption as possible. For instance, metrics that do not have sufficient data for training and metrics that are consistently constant during training periods are considered to be "normal" until their behavior changes significantly to require re-training of the ML models.
To use this feature, please enable ML on your agent and then navigate to the "Anomalies" tab in Netdata cloud. Update netdata.conf with the following information to enable ML on your agent:
[ml]
    enabled = yes
Read more about Anomaly Advisor at our blog.
Metrics Correlation on Agent
Metric Correlations allow you to quickly find metrics and charts related to a particular window of interest that you want to explore further. Metric correlations compare two adjacent windows to find how they relate to each other, and then score all metrics based on this rating, providing a list of metrics that may have influence or have been influenced by the highlighted one.
Metric Correlation was already available in Netdata Cloud, but now we are releasing a version implemented at the Netdata Agent, which drastically reduces the time required for to run. This means the metric correlation can now run almost instantly (more than 10x faster than before)!
To enable the new metric correlation at the Netdata Agent, set the following in your netdata.conf file:
[global]
    enable metric correlations = yes
Kubernetes monitoring
On very busy Kubernetes clusters where hundreds of containers spawn and are destroyed all the time, Netdata was consuming a lot of resources and was slow to detect changes and under certain conditions it missed certain containers.
Now, Netdata:
- Detects "pause" containers and skips them greatly improving the performance during discovery
- Detects containers that are initializing and postpones discovery for them until they are properly initialized
- Utilizes less resources more efficiently during container discovery
Netdata is also capable of detecting the network interfaces that have been allocated to containers, by spawning a process that switches network namespace and identifies virtual interfaces that belong to each container. This process is improved drastically, now requiring 1/3 of the CPU resources it needed before.
Additionally, Netdata cgroups.plugin now collects CPU shares for Kubernetes containers, allowing the visualization of the Kubernetes CPU Requests (Kubernetes writes in cgroup CPU Shares the CPU Requests that have been configured for the containers).
A new option has been added in netdata.conf [plugin:cgroup] section, to allow filtering containers by (resolved) name. It matches the name of the cgroup (as you see it on the dashboard).
We have also released a blog post and a video about CPU Throttling in Kubernetes. You will be amazed by our findings. Read the blog and watch the video about Kubernetes CPU throttling.
Visualization improvements
Netdata Cloud dashboards are now a lot faster in aggregating data from multiple agents, as the protocol between agents and the Cloud is approaching its final shape.
New look for Netdata charts
Netdata Cloud has a new look and feel for charts, which resembles the look and feel for coding IDEs:

New home for war rooms
The new home tab for war rooms allows you to quickly inspect the most important metrics for every war room, like number of nodes, metrics, retention, replication, alerts, users, custom dashboards, etc.

Time units
Time units now in charts auto-scale from microseconds to days, automatically based on the value of time to be shown.
Cloud queries timeout
The agent now sets a timeout on every query it sends to the agents, and the agents now respect this timeout. Previously, the cloud was timing out because of a slow query, but the agents remained busy executing that query, which had a waterfall effect on the agent load.
Custom dashboards
Custom dashboards on Netdata Cloud can now be renamed.
Alerts management
All configured alerts on the Cloud
We have added a new Alert Configs sub tab which lists all the alerts configured on all the nodes belonging to the war room. You have now a possibility of listing the alerts configured in the - war room, nodes and alert instances respectively.
Stale alerts
There have been a number of corner cases under which alerts could remain raised on Netdata cloud. We identified all such cases, and now Netdata Cloud is always in sync with Netdata agents about their alerts.
Nodes management
Cloud provider metadata
Netdata now identifies the Cloud provider node type it runs on. It works for GCP and AWS, and exposes this information at the Nodes tab, the single node dashboard, and the node inspector.

Virtualization detection fixes
We improved the virtualization detection in cases where systemd is not available. Now Netdata can properly detect virtualization even in these cases.
Global nodes filter on all tabs of a space
The new Netdata Cloud now supports a global filter on nodes of war rooms. The new filter is applied on every tab for each room, allowing users to quickly switch between tabs while retaining the nodes filtered.
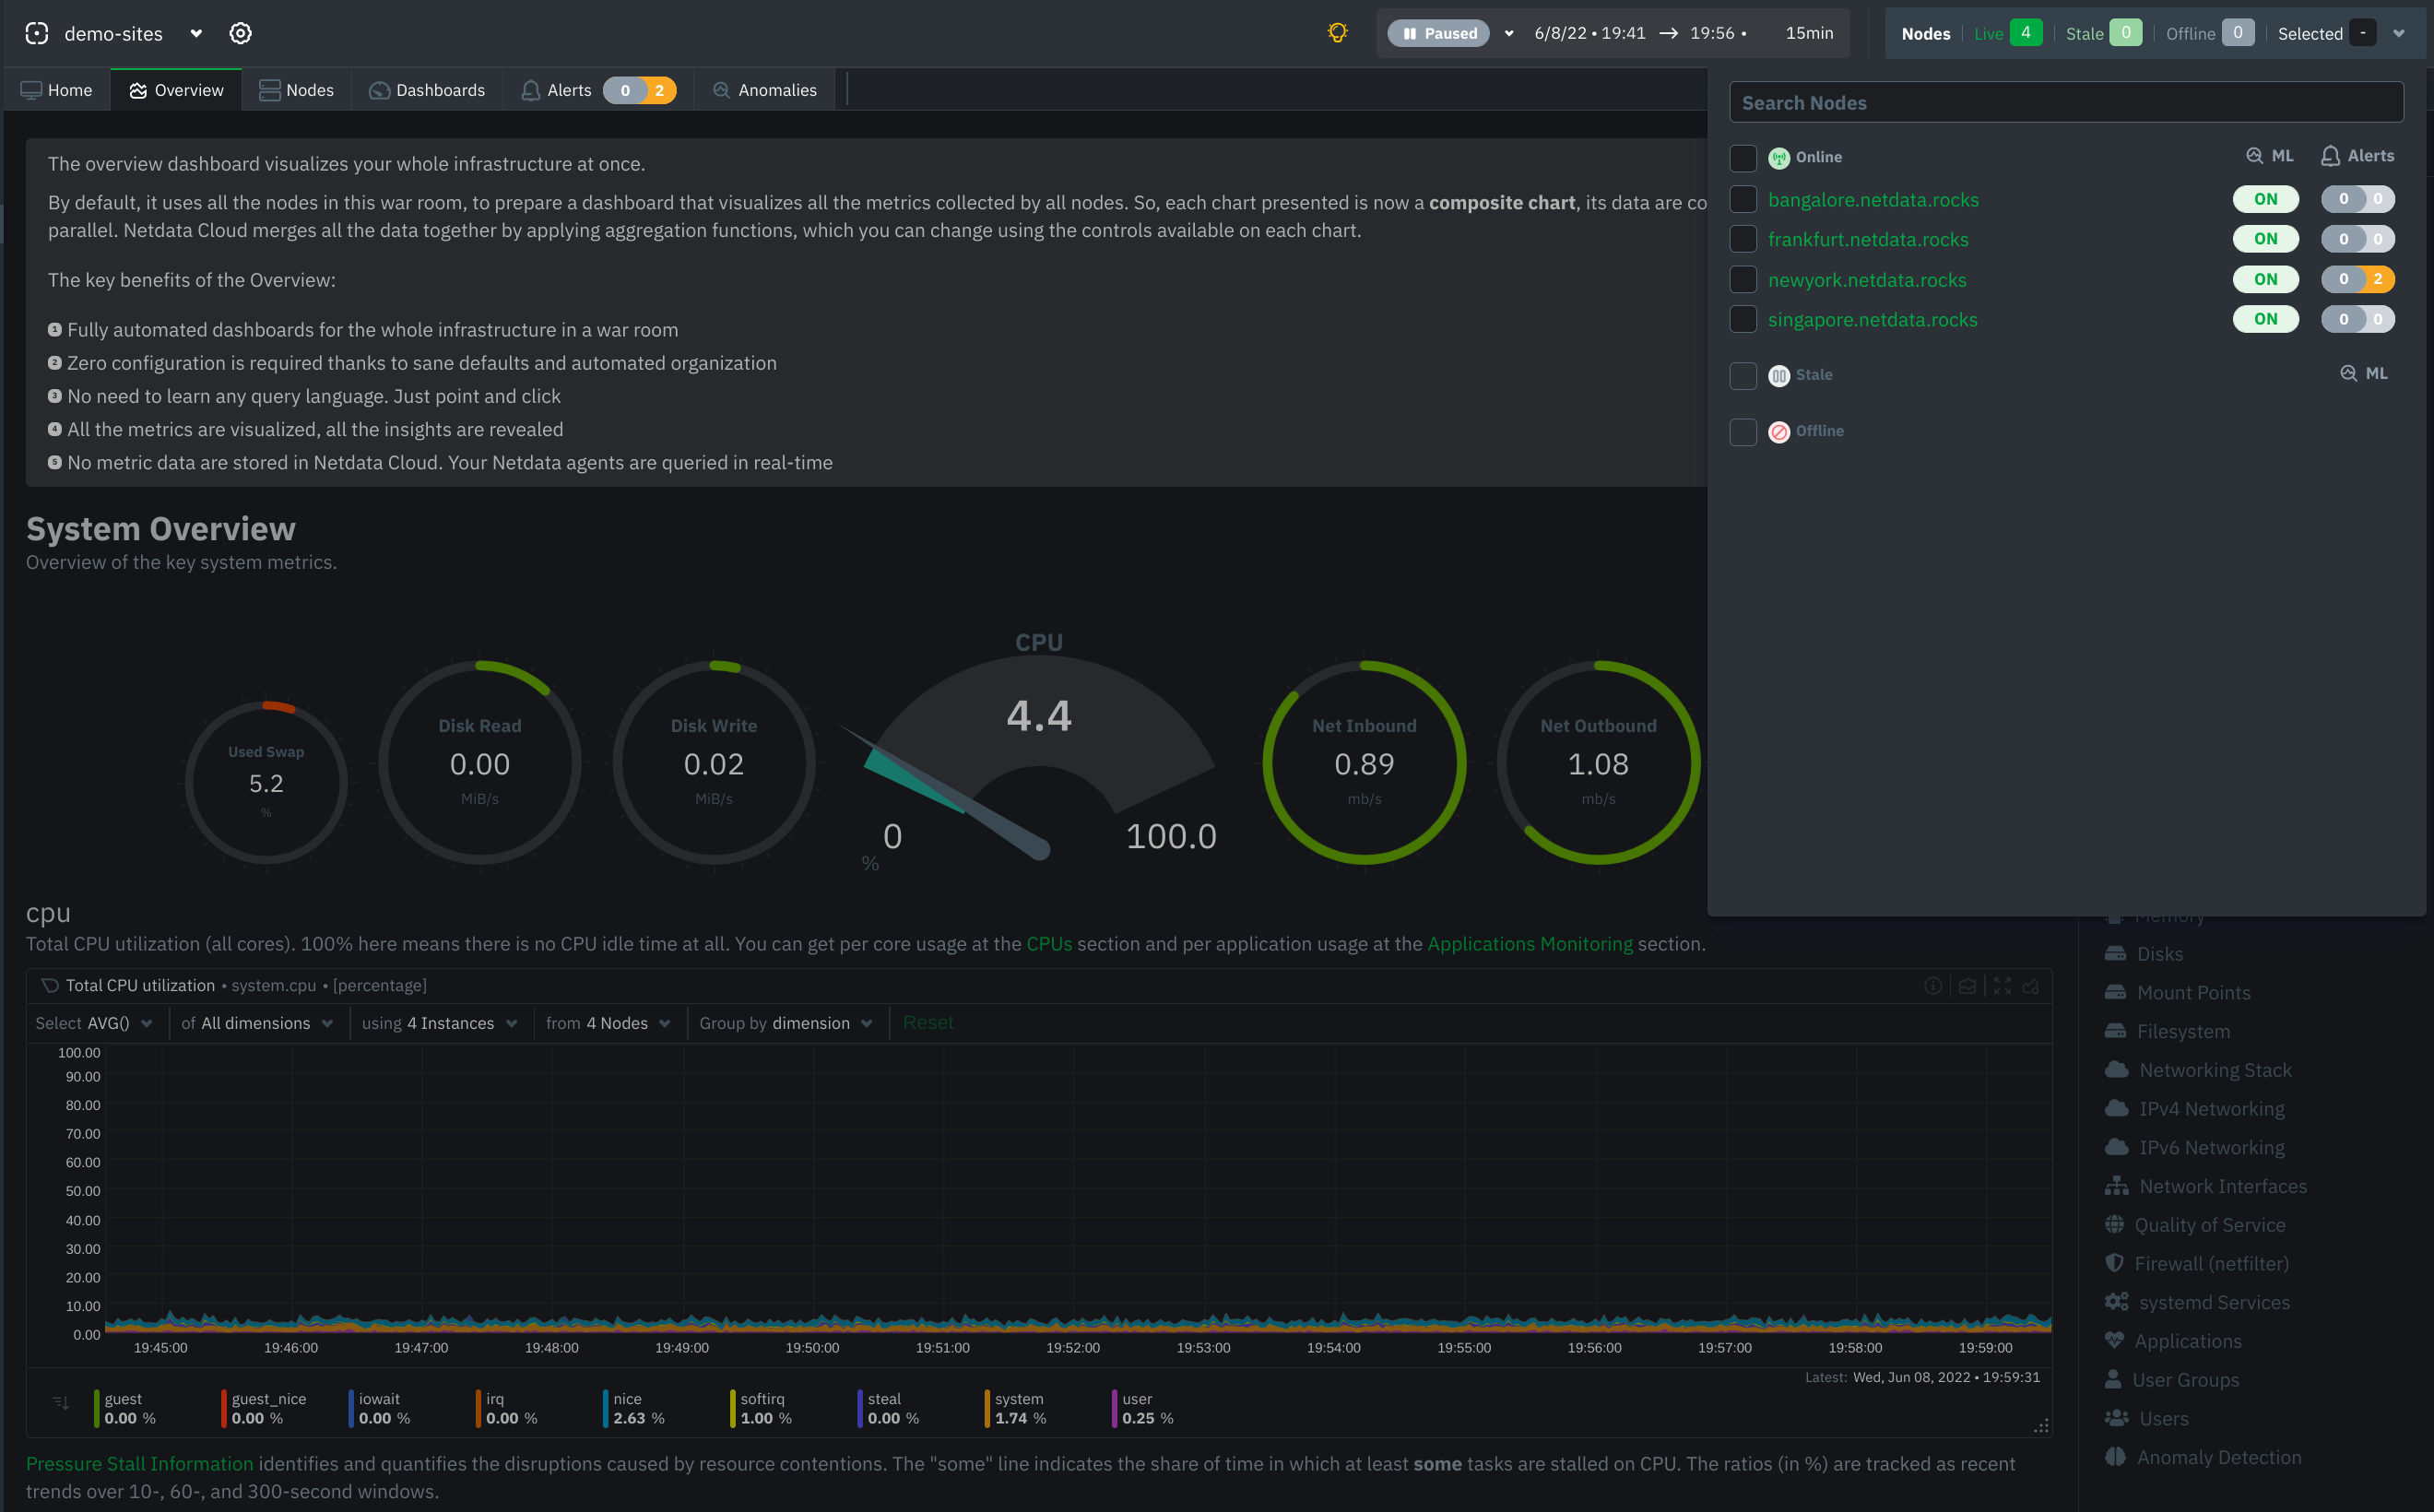
Obsoletion of nodes
Netdata admin users now have the ability to remove obsolete nodes from a space. Many users have been eagerly waiting for this feature, and we thank you for your patience. We hope you will be happy to use the feature and have cleaner spaces and war rooms. A few notes to be considered:
- Only admin users have the ability to obsolete nodes
- Only offline nodes can be marked obsolete (Live nodes and stale nodes cannot be obsoleted)
- Node obsoletion works across the entire space, so the obsoleted node will be removed from all rooms belonging to the space
- If the obsoleted nodes eventually become live or online once more, they will be automatically re-added to the space
StatsD improvements
Every Netdata Agent is a StatsD server, listening on localhost port 8125, both TCP and UDP. You can use the Netdata StatsD server to quickly visualize metrics from scripts, Cron Job, and local applications.
In this release, the Netdata StatsD server has been improved to use Judy arrays for indexing the collected metrics, drastically improving its performance.
At the same time we extended the StatsD protocol to support dictionaries . Dictionaries are similar to sets, but instead of reporting only the number of unique entries in the set, dictionaries create a counter for each of the values and report the number of occurrences for each unique event. So, to quickly get a break down of events, you can push them to StatsD like myapp.metric:EVENT|d. StatsD will create a chart for myapp.metric and for each unique EVENT it will create a dimension with the number of times this events was encountered.
We also added the ability to change the units of the chart and the family of the chart, using StatsD tags, like this: myapp.metric:EVENT|d|#units=events/s.
Finally, StatsD now automatically creates a dashboard section for every StatsD application name. Following StatsD best practices, these application names are considered to be the first keyword of collected metrics. For example, by pushing the metric myapp.metric:1|c, StatsD will create the dashboard section "StatsD myapp".
Read more at the Netdata StatsD documentation. A real-life example of using Netdata StatsD from a shell script pushing in realtime metric to a local Netdata Agent, is available at this stress-with-curl.sh gist.
3x faster agent queries
Netdata dashboards refresh all visible charts in parallel, utilizing all the resources the web browsers provide to quickly present the required charts. Since Netdata only stores metric data at the agents, all these queries are executed in parallel at the agents.
This parallelism of queries is even more intense when metrics replication/streaming is configured. In these cases, parent Netdata agents centralize metric data from many agents, and, since Netdata Cloud prefers the more distant parents for queries, they receive quite a few queries in parallel for all their children.
We also reworked many parts of the query engine of Netdata agents to achieve top performance in parallel queries. Now, Netdata agents are able to perform queries at a rate of more than 30 million points per second, per core on modern hardware. On a parent Netdata agent with a 24-core CPU we observed a sustained rate of 1.3 billion points per second! This is 3 times faster compared to the previous release.
To achieve this performance improvements we worked in these areas:
Query memory management
When querying metric data, a lot of memory allocations need to happen. Although Netdata agents automatically adapt their memory requirements for data collection avoiding memory operations while iterating to collect data, unfortunately at the query engine site, this is not feasible.
To make the agent more efficient for queries, the number of system calls allocating memory had to be drastically decreased. So, we developed a One Way Allocator (OWA), a system that works like a scratchpad for memory allocations. When the query starts, we now predict the amount of memory needed to execute the query. The query engine still does all the individual allocations, but all these are now made against the scratchpad, not against the system. OWA is smart enough to increase the size of the scratchpad if needed during querying. And it frees all memory at once without the need for individual memory releases.
For huge data queries, the benefit is astonishing. For certain heavy data queries, 45000 memory allocations before are down to 20 with this release! This doubled the performance of the query engine.
Number unpacking
To optimize its memory footprint for metric data, Netdata agents store collected metric data into a fixed step database (after interpolation) with a custom floating point number format we developed (we call it storage_number), requiring just 4 bytes per data collection point, including the timestamp. When on disk, mainly due to compression, Netdata's dbengine needs just 0.34 bytes per point (including all metadata), which is probably the best among all monitoring solutions available today, allowing Netdata to massively store and manage metric data at a very high rate.
This means however, that in order to actually use a point in a query, we have to unpack it. This unpacking happens point-by-point even for data cached in memory. 1 billion points in a data query, 1 billion numbers unpacked.
In this release we analyzed the CPU cache efficiency of the number unpacking and we refactored it to make the best use of available CPU caches to finally increase its performance by 30%.
Streaming
This release includes a better algorithm to pick the available parent to stream metrics to. The previous version was always reconnecting to the first available parent. Now it rotates them, one by one and then restarts.
An issue was fixed regarding parents with stale alerts from disconnected children. Now, the parent validates all alerts on every child re-connection.
Netdata parents now have a timeout to cleanup dead/abandoned children connections automatically.
We also worked to eliminate most of the bottlenecks when multiple children connect to the same parent. But this is still under testing, so it will make it in the next release.
More optimizations
Workers optimizations
Netdata uses many workers to execute several of its features. There are web workers, aclk workers, dbengine
workers, health monitoring workers, libuv workers, and many more.
We manage to identify a lot of deadlocks happening that slowed down the whole operation. We also
increased the amount of workers to deliver more capacity on busy parents.
There is a new section for monitoring Netdata workers at the "Netdata Monitoring" section of the dashboard. Using this
work we are still working to make them even more efficient.
Deadlocks
The last release was hindered by rare deadlocks on very busy parents. These deadlocks are now gone, improving the agents ability to centralize data from many children.
Dictionaries are now using Judy arrays
Judy arrays are probably the fastest and most CPU cache-friendly indexes available. Netdata already uses them for
dbengine and its page cache. Now all Netdata dictionaries are using them too, giving a performance boost to all
dictionary operations, including StatsD.
/proc collectors are now a lot faster >
Initialization of /proc collectors was suboptimal, because they had to go over a slow process or adapting their read
buffers. We added a forward-looking algorithm to optimize this initialization, which now happens in 1/10th of the
time.
/proc/netdev collector is now isolated
Some users have experiences gaps in /proc plugin charts. We identified that these gaps were triggered by the netdev module, which were cause the whole plugin to slow down and miss data collection iterations.
Now the netdev module of /proc plugin runs on its own thread to avoid this influencing the rest of the /proc
modules.
Internal Web Server optimizations
The internal web server of Netdata now spreads the work among its worker threads more evenly, utilizing as much of the
parallelism that is available to it.
Options in netdata.conf re-organized
We re-organized the [global] section of the netdata.conf, so that it is more meaningful for new users. The new
configurations are backward compatible. So, after you restart netdata with your old netdata.conf, grab the new one
from http://localhost:19999/netdata.conf to have the new format.
New MQTT Client - Tech Preview
We now have our own MQTT implementation within our ACLK protocol that will eventually replace the current MQTT-C client
for several reasons, including the following:
- With the new MQTT implementation we now support MQTTv5 as our older implementation only supported MQTTv3
- Reduce memory usage - no need for large fixed size buffers to be allocated all the time
- Reduce memory copying - no need to copy message contents multiple times
- Remove max message size limit
- Remove issues where big messages are starving other messages
Currently, it’s provided as a tech preview, and it’s disabled by default. Feel free to have some fun with the new
implementation. This is how to enable it in netdata.conf:
[cloud]
    mqtt5 = yes
Acknowledgments
- @JaphethLim for adding priority to Gotify notifications.
-
@MarianSavchuk for adding Alma and Rocky distros as CentOS compatibility distro in
netdata-updater. - @aberaud for working on configurable storage engine.
- @atriwidada for improving package dependency.
- @coffeegrind123 for adding Gotify notification method.
- @eltociear for fixing "GitHub" spelling in docs.
-
@fqx for adding
tailscaledto apps_groups.conf. -
@k0ste for updating
net,aws, andhagroups in apps_groups.conf. - @kklionz for fixing a compilation warning.
- @olivluca for fixing appending logs to the old log file after logrotate on Debian.
- @petecooper for improving the usage message in netdata-installer.
-
@simon300000 for adding
caddyto apps_groups.conf.
Contributions
Collectors
New
- Add "UPS Load Usage" in Watts chart (charts.d/apcupsd) (#12965, @ilyam8)
- Add Pressure Stall Information stall time charts (proc.plugin, cgroups.plugin) (#12869, @ilyam8)
- Add "CPU Time Relative Share" chart when running inside a K8s cluster (cgroups.plugin) (#12741, @ilyam8)
- Add a collector that parses the log files of the OpenVPN server (go.d/openvpn_status_log) (#675, @surajnpn)
Improvements
⚙️ Enhancing our collectors to collect all the data you need.
- Add Tailscale apps_groups.conf (apps.plugin) (#13033, @fqx)
- Skip collecting network interface speed and duplex if carrier is down (proc.plugin) (#13019, @vlvkobal)
- Run the /net/dev module in a separate thread (proc.plugin) (#12996, @vlvkobal)
- Add dictionary support to statsd (#12980, @ktsaou)
- Add an option to filter the alarms (python.d/alarms) (#12972, @andrewm4894)
- Update net, aws, and ha groups in apps_groups.conf (apps.plugin) (#12921, @k0ste)
- Add k8s_cluster_name label to cgroup charts in K8s on GKE (cgroups.plugin) (#12858, @ilyam8)
- Exclude Proxmox bridge interfaces (proc.plugin) (#12789, @ilyam8)
- Add filtering by cgroups name and improve renaming in K8s (cgroups.plugin) (#12778, @ilyam8)
- Execute the renaming script only for containers in K8s (cgroups.plugin) (#12747, @ilyam8)
- Add k8s_qos_class label to cgroup charts in K8s (cgroups.plugin) (#12737, @ilyam8)
- Reduce the CPU time required for cgroup-network-helper.sh (cgroups.plugin) (#12711, @ilyam8)
- Add Proxmox VE processes to apps_groups.conf (apps.plugin) (#12704, @ilyam8)
- Add Caddy to apps_groups.conf (apps.plugin) (#12678, @simon300000)
Bug fixes
🐞 Improving our collectors one bug fix at a time.
- Fix adding wrong labels to cgroup charts (cgroups.plugin) (#13062, @ilyam8)
- Fix cpu_guest chart context (apps.plugin) (#12983, @ilyam8)
- Fix counting unique values in Sets (statsd.plugin) (#12963, @ktsaou)
- Fix collecting data from uninitialized containers in K8s (cgroups.plugin) (#12912, @ilyam8)
- Fix CPU-specific data in the "C-state residency time" chart dimensions (proc.plugin) (#12898, @vlvkobal)
- Fix memory usage calculation by considering ZFS ARC as cache on FreeBSD (freebsd.plugin)(#12879, @vlvkobal)
- Fix disabling K8s pod/container cgroups when fail to rename them (cgroups.plugin) (#12865, @ilyam8)
- Fix memory usage calculation by considering ZFS ARC as cache on Linux (proc.plugin) (#12847, @ilyam8)
- Fix adding network interfaces when the cgroup proc is in the host network namespace (cgroups.plugin) (#12788, @ilyam8)
- Fix not setting chart units (go.d/snmp) (#682, @ilyam8)
- Fix not collecting Integer type values (go.d/snmp) (#680, @surajnpn)
eBPF
- Add CO-RE algorithms to all threads related to memory (#12684, @thiagoftsm)
- Fix wrong chart type for ip charts (#12698, @thiagoftsm)
- Fix disabled apps (ebpf.plugin) (#13044, @thiagoftsm)
- Fix "libbpf: failed to load" warnings (#12831, @thiagoftsm)
- Re-enable socket module by default (#12702, @ilyam8)
Health
- Fix not respecting host labels when creating alerts for children instances (#13053, @MrZammler)
- Expose anomaly-bit option to health (#12835, @vkalintiris)
- Add priority to Gotify notifications to trigger sound & vibration on the Gotify phone app (#12753, @JaphethLim)
- Add Gotify notification method (#12639, @coffeegrind123)
Streaming
- Improve failover logic when the Agent is configured to stream to multiple destinations (#12866, @MrZammler)
- Increase the default "buffer size bytes" to 10MB (#12913, @ilyam8)
Exporting
- Add the URL query parameter that filters charts from the /allmetrics API query (#12820, @vlvkobal)
- Make the "send charts matching" option behave the same as the "filter" URL query parameter for prometheus format (#12832, @ilyam8)
Documentation
📄 Keeping our documentation healthy together with our awesome community.
- Add note about Anomaly Advisor (#13042, @andrewm4894)
- Add a note on possibly alternate location of the cloud.d directory (#12987, @cakrit)
- Improve instructions on how to reconnect a node to Cloud (#12891, @cakrit)
- Fix unresolved file references (#12872, @ilyam8)
- Update ML defaults in docs (#12782, @andrewm4894)
- Add parent-child configuration examples to ML docs (#12734, @andrewm4894)
- Add a note about serial numbers in chart names in the plugins.d API documentation (#12733, @vlvkobal)
- Fix a typo in macOS documentation (#12724, @MrZammler)
- Add a description of interactive/non-interactive modes to the "Uninstall Netdata" doc (#12687, @odynik)
- Fix "GitHub" spelling (#12682, @eltociear)
- Add new dashboard/web server reference file (#11161, @joelhans)
Packaging / Installation
📦 "Handle with care" - Just like handling physical packages, we put in a lot of care and effort to publish beautiful
software packages.
- Add Alma Linux 9 and RHEL 9 support to CI and packaging (#13058, @Ferroin)
- Fix handling of temp directory in kickstart when uninstalling (#13056, @Ferroin)
- Only try to update repo metadata in updater script if needed (#13009, @Ferroin)
- Use printf instead of echo for printing collected warnings in kickstart (#13002, @Ferroin)
- Don't kill Netdata PIDs if successfully stopped Netdata in installer/uninstaller (#12982, @ilyam8)
- Properly handle the case when 'tput colors' does not return a number in kickstart (#12979, @ilyam8)
- Update libbpf version to v0.8.0 (#12945, @thiagoftsm)
- Update default fping version to 5.1 (#12930, @ilyam8)
- Update go.d.plugin version to v0.32.3 (#12862, @ilyam8)
- Autodetect channel for specific version in kickstart (#12856, @maneamarius)
- Fix "Bad file descriptor" error in netdata-uninstaller (#12828, @maneamarius)
- Add support for installing static builds on systems without usable internet connections (#12809, @Ferroin)
- Add --repositories-only option to kickstart (#12806, @maneamarius)
- Rename --install option for kickstart.sh (#12798, @maneamarius)
- Fix to avoid recompiling protobuf all the time (#12790, @ktsaou)
- Fix non-interpreted new lines when printing deferred errors in netdata-installer (#12786, @ilyam8)
- Fix a typo in the warning() function in netdata-installer (#12781, @ilyam8)
- Fix checking of environment file in netdata-updater (#12768, @Ferroin)
- Add a missing function and Alma and Rocky distros as CentOS compatibility distro to netdata-updater (#12757, @MarianSavchuk)
- Improve the usage message in netdata-installer (#12755, @petecooper)
- Make atomics a hard-dependency (#12730, @vkalintiris)
- Add --install-version flag for installing specific Netdata version to kickstart (#12729, @maneamarius)
- Correctly propagate errors and warnings up to the kickstart script from scripts it calls (#12686, @Ferroin)
- Fix not-respecting of NETDATA_LISTENER_PORT in docker healthcheck (#12676, @ilyam8)
- Add options to kickstart for explicitly passing options to installer code (#12658, @Ferroin)
- Improve handling of release channel selection in kickstart (#12635, @Ferroin)
- Treat auto-updates as a tristate internally in the kickstart script (#12634, @Ferroin)
- Include proper package dependency (#12518, @atriwidada)
- Fix appending logs to the old log file after logrotate on Debian (#9377, @olivluca)
Other Notable Changes
Improvements
⚙️ Greasing the gears to smoothen your experience with Netdata.
- Add hostname to mirrored hosts int the /api/v1/info endpoint (#13030, @ktsaou)
- Optimize query engine queries (#12988, @ktsaou)
- Optimize query engine and cleanup (#12978, @ktsaou)
- Improve the web server work distribution across worker threads (#12975, @ktsaou)
- Check link local address before querying cloud instance metadata (#12973, @ilyam8)
- Speed up query engine by refactoring rrdeng_load_metric_next() (#12966, @ktsaou)
- Optimize the dimensions option store to the metadata database (#12952, @stelfrag)
- Add detailed dbengine stats (#12948, @ktsaou)
- Stream Metric Correlation version to parent and advertise Metric Correlation status to the Cloud (#12940, @MrZammler)
- Move directories, logs, and environment variables configuration options to separate sections (#12935, @ilyam8)
- Adjust the dimension liveness status check (#12933, @stelfrag)
- Make sqlite PRAGMAs user configurable (#12917, @ktsaou)
- Add worker jobs for cgroup-rename, cgroup-network and cgroup-first-time (#12910, @ktsaou)
- Return stable or nightly based on version if the file check fails (#12894, @stelfrag)
- Take into account the in queue wait time when executing a data query (#12885, @stelfrag)
- Add fixes and improvements to workers library (#12863, @ktsaou)
- Pause alert pushes to the cloud (#12852, @MrZammler)
- Allow to use the new MQTT 5 implementation (#12838, @underhood)
- Set a page wait timeout and retry count (#12836, @stelfrag)
- Allow external plugins to create chart labels (#12834, @ilyam8)
- Reduce the number of messages written in the error log due to out of bound timestamps (#12829, @stelfrag)
- Cleanup the node instance table on startup (#12825, @stelfrag)
- Accept a data query timeout parameter from the cloud (#12823, @stelfrag)
- Write the entire request with parameters in the access.log file (#12815, @stelfrag)
- Add a parameter for how many worker threads the libuv library needs to pre-initialize (#12814, @stelfrag)
- Optimize linking of foreach alarms to dimensions (#12813, @vkalintiris)
- Add a hyphen to the list of available characters for chart names (#12812, @ilyam8)
- Speed up queries by providing optimization in the main loop (#12811, @ktsaou)
- Add workers utilization charts for Netdata components (#12807, @ktsaou)
- Fill missing removed events after a crash (#12803 , @MrZammler)
- Speed up buffer increases (minimize reallocs) (#12792, @ktsaou)
- Speed up reading big proc files (#12791, @ktsaou)
- Make dbengine page cache undumpable and dedupuble (#12765, @ilyam8)
- Speed up execution of external programs (#12759, @ktsaou)
- Remove per chart configuration (#12728, @vkalintiris)
- Check for chart obsoletion on children re-connections (#12707, @MrZammler)
- Add a 2 minute timeout to stream receiver socket (#12673, @MrZammler)
- Improve Agent cloud chart synchronization (#12655, @stelfrag)
- Add the ability to perform a data query using an offline node id (#12650, @stelfrag)
- Implement ks_2samp test for Metric Correlations (#12582, @MrZammler)
- Reduce alert events sent to the cloud (#12544, @MrZammler)
- Store alert log entries even if alert it is repeating (#12226, @MrZammler)
- Improve storage number unpacking by using a lookup table (#11048, @vkalintiris)
Bug fixes
🐞 Increasing Netdata's reliability one bug fix at a time.
- Fix locking access to chart labels (#13064, @stelfrag)
- Fix coverity 378625 (#13055, @MrZammler)
- Fix dictionary crash walkthrough empty (#13051, @ktsaou)
- Fix the retry count and netdata_exit check when running a sqlite3_step command (#13040, @stelfrag)
- Fix sending first time seen dimensions with zero timestamp to the Cloud (#13035, @stelfrag)
- Fix gap filling on dbengine gaps (#13027, @ktsaou)
- Fix coverity issue 378598 (#13022, @MrZammler)
- Fix coverity issue 378617,378615 (#13021, @stelfrag)
- Fix a dimension 100% anomaly rate despite no change in the metric value (#13005, @vkalintiris)
- Fix compilation warnings (#12993, @vlvkobal)
- Fix crash because of corrupted label message from streaming (#12992, @MrZammler)
- Fix nanosleep on platforms other than Linux (#12991, @vlvkobal)
- Fix disabling a streaming destination because of denied access (#12971, @MrZammler)
- Fix "unused variable" compilation warning (#12969, @kklionz)
- Fix virtualization detection on FreeBSD (#12964, @ilyam8)
- Fix buffer overflow when logging "command_to_be_logged" in analytics (#12947, @MrZammler)
- Fix "global statistics" section in netdata.conf (#12916, @ilyam8)
- Fix virtualization detection when systemd-detect-virt is not available (#12911, @ilyam8)
- Fix the log entry for incoming cloud start streaming commands (#12908, @stelfrag)
- Fix release channel in the node info message (#12905, @stelfrag)
- Fix alarms count in /api/v1/alarm_count (#12896, @MrZammler)
- Fix compilation warnings in FreeBSD (#12887, @vlvkobal)
- Fix multihost queries alignment (#12870, @stelfrag)
- Fix negative worker jobs busy time (#12867, @ktsaou)
- Fix reported by coverity issues related to memory and structure dereference (#12846, @stelfrag)
- Fix memory leaks and mismatches of the use of the z functions for allocations (#12841, @ktsaou)
- Fix using obsolete charts/dims in prediction thread (#12833, @vkalintiris)
- Fix not skipping ACLK dimension update when dimension is freed (#12777, @stelfrag)
- Fix coverity warning about not checking return value in receiver setsockopt (#12772, @MrZammler)
- Fix disk size calculation on macOS (#12764, @ilyam8)
- Fix "implicit declaration of function" compilation warning (#12756, @ilyam8)
- Fix Valgrind errors (#12619, @vlvkobal)
- Fix redirecting alert emails for a child to the parent (#12609, @MrZammler)
Code organization
🏋️ Changes to keep our code base in good shape.
- Update default value for "host anomaly rate threshold" (#13075, @shyamvalsan)
- Initialize chart label key parameter correctly (#13061, @stelfrag)
- Add the ability to merge dictionary items (#13054, @ktsaou)
- Dictionary improvements (#13052, @ktsaou)
- Coverity fixes about statsd; removal of strsame (#13049, @ktsaou)
- Replace
historywith relevantdbengineparams (#13041, @andrewm4894) - Schedule retention message calculation to a worker thread (#13039, @stelfrag)
- Check return value and log an error on failure (#13037, @stelfrag)
- Add additional metadata to the data response (#13036, @stelfrag)
- Dictionary with JudyHS and double linked list (#13032, @ktsaou)
- Initialize a pointer and add a check for it (#13023, @vlvkobal)
- Autodetect coverity install path to increase robustness (#12995, @maneamarius)
- Don't expose the chart definition to streaming if there is no metadata change (#12990, @stelfrag)
- Make heartbeat a static chart (#12986, @MrZammler)
- Return rc->last_update from alarms_values api (#12968, @MrZammler)
- Suppress warning when freeing a NULL pointer in onewayalloc_freez (#12955, @stelfrag)
- Trigger queue removed alerts on health log exchange with cloud (#12954, @MrZammler)
- Defer the dimension payload check to the ACLK sync thread (#12951, @stelfrag)
- Reduce timeout to 1 second for getting cloud instance info (#12941, @MrZammler)
- Add links to SQLite init options in the src code (#12920, @ilyam8)
- Remove "enable new cgroups detected at run time" config option (#12906, @ilyam8)
- Log an error when re-registering an already registered job (#12903, @ilyam8)
- Use correct identifier when registering the main thread "chart" worker job (#12902, @ilyam8)
- Change duplicate health template message logging level to 'info' (#12873, @ilyam8)
- Initialize the metadata database when performing dbengine stress test (#12861, @stelfrag)
- Add a SQLite database checkpoint command (#12859, @stelfrag)
- Broadcast completion before unlocking condition variable's mutex (#12822, @vkalintiris)
- Switch to mallocz() in onewayallocator (#12810, @ktsaou)
- Configurable storage engine for Netdata Agents: step 2 (#12808, @aberaud)
- Move kickstart argument parsing code to a function. (#12805, @Ferroin)
- Remove python.d/* announced in v1.34.0 deprecation notice (#12796, @ilyam8)
- Don't use MADV_DONTDUMP on non-linux builds (#12795, @vkalintiris)
- One way allocator to double the speed of parallel context queries (#12787, @ktsaou)
- Trace rwlocks of netdata (#12785, @ktsaou)
- Configurable storage engine for Netdata Agents: step 1 (#12776, @aberaud)
- Some config updates for ML (#12771, @andrewm4894)
- Remove node.d.plugin and relevant files (#12769, @surajnpn)
- Use aclk_parse_otp_error on /env error (#12767, @underhood)
- Remove "search for cgroups under PATH" conf option to fix memory leak (#12752, @ilyam8)
- Remove "enable cgroup X" config option on cgroup deletion (#12746, @ilyam8)
- Remove undocumented feature reading cgroups-names.sh when renaming cgroups (#12745, @ilyam8)
- Reduce logging in rrdset (#12739, @ilyam8)
- Avoid clearing already unset flags. (#12727, @vkalintiris)
- Remove commented code (#12726, @vkalintiris)
- Remove unused
--auto-updateoption when using static/build install method (#12725, @ilyam8) - Allocate buffer memory for uv_write and release in the callback function (#12688, @stelfrag)
- Implements new capability fields in aclk_schemas (#12602, @underhood)
- Cleanup Challenge Response Code (#11730, @underhood)
Deprecation notice
The following items will be removed in our next minor release (v1.36.0):
Patch releases (if any) will not be affected.
| Component | Type | Will be replaced by |
|---|---|---|
| python.d/chrony | collector | go.d/chrony |
| python.d/ovpn_status_log | collector | go.d/openvpn_status_log |
All the deprecated components will be moved to the netdata/community repository.
Deprecated in this release
In accordance with our previous deprecation notice, the following items have been removed in this release:
| Component | Type | Replaced by |
|---|---|---|
| node.d | plugin | - |
| node.d/snmp | collector | go.d/snmp |
| python.d/apache | collector | go.d/apache |
| python.d/couchdb | collector | go.d/couchdb |
| python.d/dns_query_time | collector | go.d/dnsquery |
| python.d/dnsdist | collector | go.d/dnsdist |
| python.d/elasticsearch | collector | go.d/elasticsearch |
| python.d/energid | collector | go.d/energid |
| python.d/freeradius | collector | go.d/freeradius |
| python.d/httpcheck | collector | go.d/httpcheck |
| python.d/isc_dhcpd | collector | go.d/isc_dhcpd |
| python.d/mysql | collector | go.d/mysql |
| python.d/nginx | collector | go.d/nginx |
| python.d/phpfpm | collector | go.d/phpfpm |
| python.d/portcheck | collector | go.d/portcheck |
| python.d/powerdns | collector | go.d/powerdns |
| python.d/redis | collector | go.d/redis |
| python.d/web_log | collector | go.d/weblog |
Platform Support Changes
This release adds official support for the following platforms:
- RHEL 9.x, Alma Linux 9.x, and other compatible RHEL 9.x derived platforms
- Alpine Linux 3.16
This release removes official support for the following platforms:
- Fedora 34 (support ended due to upstream EOL).
- Alpine Linux 3.12 (support ended due to upstream EOL).
This release includes the following additional platform support changes.
- We’ve switched from Alpine 3.15 to Alpine 3.16 as the base for our Docker images and static builds. This should not
require any action on the part of users, and simply represents a version bump to the tooling included in our Docker
images and static builds. - We’ve switched from Rocky Linux to Alma Linux as our build and test platform for RHEL compatible systems. This will
enable us to provide better long-term support for such platforms, as well as opening the possibility of better support
for non-x86 systems.
Netdata Agent Release Meetup
Join the Netdata team on the 9th of June at 5pm UTC for the Netdata Agent Release Meetup, which will be held on
the Netdata Discord.
Together we’ll cover:
- Release Highlights
- Acknowledgements
- Q&A with the community
RSVP now - we look forward to
meeting you.
Support options
As we grow, we stay committed to providing the best support ever seen from an open-source solution. Should you encounter
an issue with any of the changes made in this release or any feature in the Netdata Agent, feel free to contact us
through one of the following channels:
-
Netdata Learn: Find documentation, guides, and reference material for monitoring and
troubleshooting your systems with Netdata. -
GitHub Issues: Make use of the Netdata repository to report bugs or open
a new feature request. -
GitHub Discussions: Join the conversation around the Netdata
development process and be a part of it. -
Community Forums: Visit the Community Forums and contribute to the collaborative
knowledge base. -
Discord: Jump into the Netdata Discord and hangout with like-minded sysadmins,
DevOps, SREs and other troubleshooters. More than 1100 engineers are already using it!
Published by netdatabot over 2 years ago
This patch release fixes versioning issues that occured in the latest release (Netdata v1.34):
- The release artifacts on the release itself showed a version of v1.33.1-339-g0046735ba instead of v1.34.0
- The binaries for the release, irrespective of the source, also showed the same version.
- The Docker images for the release have incorrect image tags that are inconsistent with our previous Docker image tag.
- Git tags ended up partially duplicated.
Support options
Supporting people in using and building with Netdata is very important to us! Should you need any help or encounter an issue with any of the changes made in this release, feel free to get in touch with the community through the following channels:
- GitHub: Report bugs or submit a new feature request.
- GitHub Discussions: Share your ideas, and be part of the Netdata Agent development process.
- Community forum: Collaborate with other troubleshooters in building a community-driven knowledge base around Netdata.
- Discord: Join us in celebrating the culture of infrastructure monitoring. Hang out with like-minded sysadmins, SREs, and troubleshooters.
Published by netdatabot over 2 years ago
Table of contents
- Kubernetes Monitoring: new charts for CPU throttling
- Machine learning (ML) powered anomaly detection
- Streaming compression now enabled by default
- SNMP collector now runs on Go
- Improved installation experience
❗ We're keeping our codebase healthy by removing features that are end of life. Read the deprecation notice to check if you are affected.
Netdata open-source Agent statistics
We're proud to empower each and every one of you to troubleshoot your infrastructure using Netdata:
- 7.3M+ troubleshooters monitor with Netdata
- 1.3M+ unique nodes currently live
- 3.3k+ new nodes per day
- 51k+ Docker pulls per day with 387M all-time total
If you're part of our community and love Netdata, please give us a star on GitHub⭐.
Release highlights
Kubernetes Monitoring: New charts for CPU throttling
Have you seen your applications get stuck or fail to respond to health checks? It might be the CPU quota limit!
Kubernetes relies on the kernel control group (cgroup) mechanisms to manage CPU constraints. The CPU quota is allocated based on a period of time, not on available CPU power. When an application has used its allotted quota for a given period, it gets throttled until the next period.
So if you don’t set your CPU limits correctly, your applications will be throttled while your CPU may be idle. And CPU throttling is really hard to identify since Kubernetes only exposes usage metrics.
In this release, we make troubleshooting Kubernetes even easier by adding two new charts for CPU throttling:
- CPU throttled Runnable Periods: The percentage of runnable periods when tasks in a cgroup have been throttled.
- CPU throttled Time Duration: The total time duration for which tasks in a cgroup have been throttled.

Machine learning (ML) powered anomaly detection
The performance of the machine learning threads have been significantly optimized in this release. We were able to reduce peak CPU usage considerably by sampling input data randomly and excluding constant metrics from training. That way, we've optimized performance while maintaining high levels of accuracy. If you're streaming data between nodes: We've optimized CPU usage on parent nodes with multiple child nodes by altering the training thread's max sleep time.
Streaming compression is now in Alpha
We introduced streaming compression in Netdata Agent v1.33.0 as a tech preview. The feature has matured a lot since then so we are moving forward to alpha stage. From now on, streaming compression will be enabled by default, allowing you to leverage faster streaming between parent and child nodes at a lower bandwidth.
SNMP collector now runs on Go
Go is known for its reliability and blazing speed - precisely what you need when monitoring networks. We've rewritten our SNMP collector from Node.js to Go. Apart from improved configuration options, the new collector eliminates the need for Node.js, slimming down our dependency tree.
Note: The node.js-based SNMP collector will be deprecated in the next release, see the deprecation notice.
📄 SNMP Go collector documentation
Improved installation experience
We have been improving our kickstart script to give you a smooth installation experience. We've added some handy features like:
- Dry run mode: Show what would be done without actually modifying the system, including reporting a number of common installation issues before they arise.
- Overhauled auto-update management: Including support for auto-updates with our native packages and much easier control of whether auto updates are enabled or not.
- Improved reinstallation support: With the new
--reinstall-cleanoption, you can now have the kickstart script cleanly uninstall an existing installation before installing Netdata again.
Acknowledgments
We would like to thank our dedicated, talented contributors that make up this amazing community. The time and expertise that you volunteer is essential to our success. We thank you and look forward to continue to grow together to build a remarkable product.
- @xrgman for fixing typos in our documentation.
- @wooyey for fixing a parsing error in python.d/hpssa collector.
-
@tycho for fixing python collector that use
sudo. - @tnagorran for fixing a typo in the step-by-step Netdata guide.
- @rex4539 for fixing typos.
- @petecooper for improving the installer script usage message.
- @godismyjudge95 for fixing a bug in the updater script.
- @fayak for fixing parsing of claiming extra parameters in kickstart.
- @dvdmuckle for fixing a typo in ZFS ARC Cache size dashboard info.
- @d--j for fixing setting of 'time offset' configuration option in timex plugin.
-
@cimnine for fixing a bug when
tarcan not set the correct permissions during installation. - @AlexGhiti for fixing building Netdata on riscv64.
- @Daniel15 for fixing license URL.
- @MariosMarinos for fixing a typo in the anomaly-detection-python.md file.
- @RatishT for fixing typo in Running-behind-haproxy.md.
- @DanTheMediocre for improving timex plugin documentation and dashboard info.
- @DanTheMediocre for fixing a typo in anomaly-detection-python.md.
- @Steve8291 for fixing ioping_disk_latency alarm lookup value.
- @Steve8291 for fixing config file check in stock config directory in ioping plugin.
- @Steve8291 for adding a link to Netdata badges readme in the health documentation.
- @Steve8291 for fixing libnetfilter-acct-dev package name in nfacct plugin documentation.
Collectors
New collectors
- Add CPU throttling charts (cgroups.plugin) (#12591, @ilyam8)
- Add clock status chart (timex.plugin) (#12501, @ilyam8)
- Add Asterisk configuration file with synthetic charts (statsd.plugin) (#12381, @ilyam8)
- Add new chart for process states metrics (apps.plugin) (#12305, @surajnpn)
- Add thermal zone metrics collection (go.d/wmi) (#667, @ilyam8)
- Add SNMP data collector (go.d/snmp) (#644, @surajnpn)
Improvements
⚙️ Enhancing our collectors to collect all the data you need.
- Add 'locust' to apps_groups.conf (#12498, @andrewm4894)
- Enable timex plugin for non-linux systems (timex.plugin) (#12489, @surajnpn)
- Prefer 'blkio.*_recursive' files when available (cgroups.plugin) (#12462, @ilyam8)
- Add 'stress-ng' and 'gremlin' to apps_groups.conf (apps.plugin) (#12165, @andrewm4894)
- Add Apple Filing Protocol daemons into 'afp' group (apps.plugin) (#12078, @ilyam8)
- Show the number of processes/threads for empty apps groups (apps.plugin) (#11834, @vlvkobal)
- Add a configuration option to set application (go.d/prometheus) (#669, @ilyam8)
Bug fixes
🐞 Improving our collectors one bug fix at a time.
- Fix collecting data when 'ntp_adjtime' call fails (timex.plugin) (#12667, @vlvkobal)
- Fix chart titles with instance-specific information (#12644, @ilyam8)
- Fix CPU utilization calculation (cgroups.plugin) (#12622, @ilyam8)
- Fix checking for IOMainPort on MacOS (macos.plugin) (#12600, @vlvkobal)
- Fix cgroup version detection with systemd (cgroups.plugin) (#12553, @vlvkobal)
- Fix network charts context (cgroups.plugin) (#12454, @ilyam8)
- Fix sending unnecessary data in FreeBSD (apps.plugin) (#12446, @surajnpn)
- Fix charts context (cups.plugin) (#12444, @ilyam8)
- Fix recursion in apcupsd_check (charts.d/apcupsd) (#12418, @ilyam8)
- Fix double host prefix when Netdata running in a podman container (cgroups.plugin) (#12380, @ilyam8)
- Fix config file check in stock config directory (ioping.plugin) (#12327, @Steve8291)
- Fix setting of 'time offset' configuration option (timex.plugin) (#12281, @d--j)
- Fix logical drive data parsing error (python.d/hpssa) (#12206, @wooyey)
- Fix getting username when UID is unknown on the host (python.d/nvisia_smi) (#12184, @ilyam8)
- Fix a typo in ZFS ARC Cache size info (#12138, @dvdmuckle)
- Fix collecting of renamed metrics (go.d/k8s_kubelet) (#674, @ilyam8)
- Fix reading stock configuration files in k8s (go.d.plugin) (#670, @ilyam8)
- Fix runtime chart context hard coding (go.d.plugin) (#668, @ilyam8)
- Fix failed check because of invalid metric type (go.d/prometheus) (#665, @ilyam8)
- Fix handling of replica set charts dimensions (go.d/mongodb) (#646, @ilyam8)
eBPF
Improvements
- Improve chart titles and dashboard info (#12665, @thiagoftsm)
- Update eBPF dashboard info (#12617, @thiagoftsm)
- Update links in the dashboard info (#12581, @thiagoftsm)
- Add monitoring for inbound and outbound connections (#12532, @thiagoftsm)
- Improve eBPF dashboard info (#12467, @thiagoftsm)
- Add CO-RE support for eBPF plugin (#12318, @thiagoftsm)
- Update libbpf version and adjust eBPF modules for using new version of libbpf (#12190, @thiagoftsm)
Bug fixes
🐞 Improving eBPF integration one bug fix at a time.
- Fix missing chart context for cgroups charts (#12671, @ilyam8)
- Fix eBFP plugin crash on exit (#12590, @thiagoftsm)
- Fix unnecessary error log lines for proc and sys files (#12385, @thiagoftsm)
- Fix removing pid file on exit (#12379, @thiagoftsm)
Dashboard
- Change color of Netdata logo on left sidebar (#12607)
- Update Community section and the links for opening a new issue on GitHub in 'Need Help?' modal (#12607)
- Add 'Netdata Cloud connection status' modal (#12407)
Streaming
- Fix parsing of 'os_name' for older agent versions streaming to a parent (#12425, @stelfrag)
- Deactivate streaming compression at runtime in case of a compressor buffer overflow (#12037, @odynik)
Exporting
Health
- Fix ioping_disk_latency alarm green/red thresholds (#12351, @ilyam8)
- Fix ioping_disk_latency alarm lookup value (#12329, @Steve8291)
- Adjust 10s_ipv4_tcp_resets_sent alarm warn expression (#12320, @ilyam8)
- Add alarms for charts.d/nut collector (#12285, @ilyam8)
- Fix respecting of 'delay' parameter when using 'repeat' feature (#12164, @erdem2000)
ML
- Fix training/prediction stats charts context (#12610, @vkalintiris)
- Enable streaming of anomaly_detection.* charts (#12606, @vkalintiris)
- Update ML-related charts (#12574, @vkalintiris)
- Reduce min 'dbengine anomaly rate every' from 60s to 30s (#12543, @andrewm4894)
- ML-related changes to address issue/discussion comments. (#12494, @vkalintiris)
- Skip 'foreach' alarms for dimensions of anomaly rate chart. (#12441, @vkalintiris)
- Prepend context in anomaly rate dimension id (#12342, @vkalintiris)
- Skip training of constant metrics (#12212, @vkalintiris)
- Track anomaly rates with DBEngine (#12083, @vkalintiris)
Packaging / Installation
📦 "Handle with care" - Just like handling physical packages, we put in a lot of care and effort to publish beautiful software packages.
- Summarize encountered errors and warnings at end of kickstart script run (#12636, @Ferroin)
- Fix logging an incorrect configuration option in kickstart (#12657, @MrZammler)
- Add eBPF CO-RE version and checksum files to distfile list (#12627, @Ferroin)
- Fix "print: command not found" issue in kickstart (#12615, @maneamarius)
- Check if libatomic can be linked (#12583, @MrZammler)
- Fix missing setuid bit for ioping.plugin after reinstalling Debian package (#12580, @ilyam8)
- Improve kickstart messaging (#12577, @Ferroin)
- Fix temporary directory handling for dependency handling script in updater (#12562, @Ferroin)
- Improve netdata-updater logging messages (#12557, @ilyam8)
- Fix building on MacOS (#12554, @underhood)
- Fix FreeBSD bundled protobuf build if system one is present (#12552, @underhood)
- Add '--reinstall-clean' flag to kickstart (#12548, @maneamarius)
- Fix enabling netdata.service during installation on Debian/Ubuntu (#12542, @ralphm)
- Upgrade protocol buffer version to 3.19.4 (#12537, @surajnpn)
- Remove using non-default values for CPU scheduling policy/OOM score in native packages (#12529, @ilyam8)
- Fix enabling auto-updates in kickstart when the script is run as a normal user (#12526, @ilyam8)
- Fix netdata-updater script for Debian packages (#12524, @ilyam8)
- Fix importing Gpg Keys issue on Centos when installing Netdata in interactive mode (#12519, @maneamarius)
- Fix importing Gpg Keys issue on Centos7 when installing Netdata in interactive mode (#12506, @maneamarius)
- Skip running the updater in kickstart dry-run mode (#12497, @Ferroin)
- Add '--force-update' parameter to netdata-updater (#12493, @ilyam8)
- Fix enabling auto-updates in the netdata-updater.sh script (#12491, @ilyam8)
- Bump the debhelper compat level to 10 in our DEB packaging code. (#12488, @Ferroin)
- Recognize Almalinux as an RHEL clone (#12487, @Ferroin)
- Update static build components to latest versions (#12461, @ktsaou)
- Add support for passing extra claiming options when claiming with Docker (#12457, @Ferroin)
- Fix detection of install type when static or build installation was performed on a native-supported platform (#12438, @maneamarius)
- Fix checksum validation error when installing on BSD systems (#12429, @ilyam8)
- Lowercase uuidgen value in the netdata-claim script (#12422, @ilyam8)
- Add a delay between starting Netdata and checking pids (#12420, @ilyam8)
- Allow updates without environment files in some cases (#12400, @Ferroin)
- Reorder functions properly in updater script (#12399, @Ferroin)
- Fix shellcheck warnings in Docker run.sh (#12377, @ilyam8)
- Fix handling of checks for newer updater script on update (#12367, @Ferroin)
- Unconditionally link against libatomic (#12366, @AlexGhiti)
- Redirect dependency handling script output to logfile when running from the updater (#12341, @Ferroin)
- Use default "bind to" in native packages (#12336, @ilyam8)
- Use the built agent version for Netdata static build archive name (#12335, @Ferroin)
- Set repo priority in YUM/DNF repository configuration (#12332, @Ferroin)
- Add a dry run mode to the kickstart script (#12322, @Ferroin)
- Provide better handling of config files in Docker containers (#12310, @Ferroin)
- Fix uninstall using kickstart flag (#12304, @maneamarius)
- Fixing writing to stderr on success when testing tmpdir in updater (#12298, @godismyjudge95)
- Switch to using netdata-updater.sh to toggle auto updates on and off when installing (#12296, @Ferroin)
- Pull in build dependencies when updating a locally built install (#12294, @Ferroin)
- Fix setting of claiming extra parameters in kickstart (#12289, @ilyam8)
- Fix incorrect install-type on some older nightly installs (#12282, @Ferroin)
- Add proper handling for legacy kickstart install detection (#12273, @Ferroin)
- Revise claiming error message in kickstart script (#12248, @Ferroin)
- Fix libc detection when installing eBPF plugin (#12242, @thiagoftsm)
- Fix license URL (#12219, @Daniel15)
- Add support to the updater to toggle auto-updates on and off (#12202, @Ferroin)
- Fix detection of existing installs in kickstart (#12199, @Ferroin)
- Make netdata-uninstaller.sh POSIX compatibility and add --uninstall flag (#12195, @maneamarius)
- Add warning about broken Docker hosts in container entrypoint (#12175, @Ferroin)
- Tidy up the installer script usage message (#12171, @petecooper)
- Bundle protobuf on CentOS 7 and earlier (#12167, @Ferroin)
- Fix parsing of claiming extra parameters in kickstart (#12148, @fayak)
- Improve messaging around unknown install handling in kickstart script (#12134, @Ferroin)
- Rename DO_NOT_TRACK to DISABLE_TELEMETRY (#12126, @ilyam8)
- Overhaul handling of auto-updates in the installer code (#12076, @Ferroin)
- Add handling for claiming non-standard install types with kickstart (#12064, @Ferroin)
- Add '--no-same-owner' to 'tar xf' in installer (#11940, @cimnine)
- Update netdata-service CapabilityBoundingSet to fix collectors using sudo (#10201, @tycho)
Documentation
📄 Keeping our documentation healthy together with our awesome community.
- Update the streaming docs to reflect the default settings for stream compression (#12669, @odynik)
- Add missing configuration options to ML readme file (#12575, @andrewm4894)
- Update anonymous-statistics readme for PostHog Cloud (#12571, @andrewm4894)
- Fix unresolved file references (#12528, @ilyam8)
- Improve eBPF documentation (#12503, @thiagoftsm)
- Improve timex plugin documentation and dashboard info description (#12495, @DanTheMediocre)
- Remove mention of py2/py3 compatibility from python plugin readme (#12465, @ilyam8)
- Fix broken link in streaming docs (#12428, @kickoke)
- Add content for eBPF docs (#12417, @thiagoftsm)
- Add link to Netdata badges readme in health docs (#12412, @Steve8291)
- Add missing frontmatter in ML docs (#12353, @kickoke)
- Fix libnetfilter-acct-dev package name in nfacct plugin docs (#12326, @Steve8291)
- Fix a typo in anomaly-detection-python.md (#12317, @DanTheMediocre)
- Add ML notebooks (#12313, @andrewm4894)
- Fix typos in Running-behind-haproxy.md (#12272, @RatishT)
- Fix a typo in the step-by-step Netdata guide (#12263, @tnagorran)
- Fix a typo in anomaly-detection-python.md file (#12220, @MariosMarinos)
- Fix typos in documentation (#12208, @xrgman)
- Add a note about known issues on older hosts with seccomp enabled and claiming (#12192, @ilyam8)
- Fix unresolved file references (#12191, @ilyam8)
- Fix various typos (#12183, @rex4539)
- Fix claiming command in the kickstart readme (#12161, @kickoke)
- Remove Google Analytics from the docs (#12145, @kickoke)
- Improve kickstart cloud installation docs (#12143, @kickoke)
- Fixed broken links (#12142, @kickoke)
- Improve Amazon SNS notification method readme (#11946, @kickoke)
Other notable changes
Improvements
⚙️ Greasing the gears to smoothen your experience with Netdata.
- Add a chart label filter parameter in context data queries (#12652, @stelfrag)
- Add a timeout parameter to data queries (#12649, @stelfrag)
- Add k8s cluster name to host labels (GKE only) (#12638, @ilyam8)
- Add cloud providers info to host labels and /api/v1/info (#12613, @ilyam8)
- Reduce logging on child reconnect (#12594, @ilyam8)
- Improve ACLK sync logging (#12534, @stelfrag)
- Add more info to netdatacli 'aclk-state' (#12458, @underhood)
- Remove "web files" options leftovers (#12403, @ilyam8)
- Improve agent to cloud synchronization performance (#12348, @stelfrag)
- Remove owner check from webserver (#12339, @thiagoftsm)
- Change default OOM score and scheduling policy to behave more sanely (#12271, @Ferroin)
- Add more info to aclk-state API call (#12231, @underhood)
- Add -W keepopenfds option (#12211, @vkalintiris)
- Remove chart specific configuration from netdata.conf except enabled (#12209, @stelfrag)
- Improve cleaning up of orphan hosts (#12201, @stelfrag)
- Add install method to /api/v1/info as label (#12040, @underhood)
- Add all query types to aclk_processed_query_type (#12036, @underhood)
- Create a removed alert event if chart goes obsolete (#12021, @MrZammler)
- Add chart for incoming proto msgs in new cloud protocol (#11969, @underhood)
Bug fixes
🐞 Increasing Netdata's reliability one bug fix at a time.
- Fix deadlock when deleting a child instance host and ML training is running (#12681, @vkalintiris)
- Fix Netdata crash during anomaly calculation (#12672, @vkalintiris)
- Fix not clean ACLK shutdown when agent is shutting down (#12625, @underhood)
- Fix shutting down the agent when the creation of the management API key file failed (#12623, @MrZammler)
- Fix respecting of dimension hidden option when executing a query (#12570, @stelfrag)
- Fix Agent crash on api/v1/info call (#12565, @erdem2000)
- Fix CPU frequency detection in system-info.sh (#12550, @ilyam8)
- Fix sending alert events with missing timezone data (#12547, @MrZammler)
- Fix invalid pointer reference when executing agent CLI commands (#12540, @stelfrag)
- Fix memory leaks on Netdata exit (#12511, @vlvkobal)
- Fix wrong 'metrics-count' in /api/v1/info (#12504, @vkalintiris)
- Fix issue with charts not properly synchronized with the cloud (#12451, @stelfrag)
- Fix high CPU usage for unclaimed agents (#12449, @underhood)
- Fix CPU frequency detection of FreeBSD (#12440, @ilyam8)
- Fix a case when claim_id is sent in uppercase (#12423, @underhood)
- Fix crash when netdatacli command output too long (#12393, @underhood)
- Fix Netdata crash on ACLK alerts streaming (#12392, @MrZammler)
- Fix build info output when dbengine is not compiled (#12354, @underhood)
- Fix container virtualization detection with systemd-detect-virt (#12338, @ilyam8)
- Fix returning 0 for unknown CPU frequency in system-info.sh (#12323, @ilyam8)
- Fix CPU frequency detection for containers (#12306, @ilyam8)
- Fix CPU info detection on macOS (#12293, @ilyam8)
- Fix long timeouts on the cloud because the agent does not respond for failed queries with a failed message (#12277, @underhood)
- Fix registration of child nodes in the cloud through the parent (#12241, @stelfrag)
- Fix node information send to the cloud for older agent versions (#12223, @stelfrag)
- Fix Netdata crash on ACLK alerts streaming when 'info' field is missing (#12210, @MrZammler)
- Fix claiming with wget (#12163, @ilyam8)
- Fix CPU frequency calculation in system-info.sh (#12162, @ilyam8)
- Fix data query option allow_past to correctly work in memory mode ram and save (#12136, @stelfrag)
- Fix the format=array output in context queries (#12129, @stelfrag)
- Fix Netdata crash when there are charts with ids which differ only by symbols that are not '_' or alphanumeric and no unique names are provided (#12067, @vlvkobal)
Code organization
🏋️ Changes to keep our code base in good shape.
- Fix a compilation warning (#12608, @vlvkobal)
- Make sure registered static threads are unique (#12538, @vkalintiris)
- Fix configure output of eBPF plugin (#12471, @underhood)
- Don't send an alert snapshot with snapshot_id 0 (#12469, @MrZammler)
- Implement fine-grained errors to cloud queries (#12460, @underhood)
- Initialize foreach alarms of dimensions in health thread (#12452, @vkalintiris)
- Add delay on missing private key (#12450, @underhood)
- Update build/m4/ax_pthread.m4 (#12390, @vkalintiris)
- Delay removed event for 60 seconds after the chart's last collected time (#12388, @MrZammler)
- Update Agent version in the Swagger API (#12374, @tkatsoulas)
- Replace write with read locks (#12309, @MrZammler)
- Add node_id into mirrored_hosts list (#12307, @underhood)
- Remove unused variable in the system-info script (#12297, @ilyam8)
- Only store alert hashes when iterated from localhost (#12292, @MrZammler)
- Adjust cloud dimension update frequency (#12284, @stelfrag)
- Add host labels _aclk_ng_new_cloud_protocol (#12278, @underhood)
- Null terminate decoded_query_string if there are no url parameters. (#12266, @MrZammler)
- Set a version number for the metadata database to better handle future data migrations (#12249, @stelfrag)
- Fix builds where HAVE_C___ATOMIC is not defined. (#12240, @vkalintiris)
- Remove unused code (#12230, @underhood)
- Store dimension hidden option in the metadata db (#12196, @stelfrag)
- Remove check for ACLK_NG and PROMETHEUS_WRITE in order to assume PROTOBUF (#12168, @MrZammler)
- Fix compilation warnings on macOS (#12082, @vlvkobal)
- Remove SIZEOF_VOIDP and ENVIRONMENT{32,64} macros. (#12046, @vkalintiris)
- Remove unused NETDATA_NO_ATOMIC_INSTRUCTIONS macro (#12045, @vkalintiris)
- Remove NETDATA_WITH_UUID def because it's not used anywhere. (#12044, @vkalintiris)
- Inform cloud about inability to satisfy request (#12041, @underhood)
- Remove ACLK_NEWARCH_DEVMODE (#12018, @underhood)
Deprecation notice
The following items will be removed in our next minor release (v1.35.0):
Patch releases (if any) will not be affected.
| Component | Type | Replaced by |
|---|---|---|
| node.d | plugin | - |
| node.d/snmp | collector | go.d/snmp |
| python.d/apache | collector | go.d/apache |
| python.d/couchdb | collector | go.d/couchdb |
| python.d/dns_query_time | collector | go.d/dnsquery |
| python.d/dnsdist | collector | go.d/dnsdist |
| python.d/elasticsearch | collector | go.d/elasticsearch |
| python.d/energid | collector | go.d/energid |
| python.d/freeradius | collector | go.d/freeradius |
| python.d/httpcheck | collector | go.d/httpcheck |
| python.d/isc_dhcpd | collector | go.d/isc_dhcpd |
| python.d/mysql | collector | go.d/mysql |
| python.d/nginx | collector | go.d/nginx |
| python.d/phpfpm | collector | go.d/phpfpm |
| python.d/portcheck | collector | go.d/portcheck |
| python.d/powerdns | collector | go.d/powerdns |
| python.d/redis | collector | go.d/redis |
| python.d/web_log | collector | go.d/weblog |
All the deprecated components will be moved to the netdata/community repository.
Deprecated in this release
In accordance with our previous deprecation notice, the following items have been removed in this release:
| Component | Type | Replaced by |
|---|---|---|
| backends | subsystem | exporting engine |
| node.d/fronius | collector | - |
| node.d/sma_webbox | collector | - |
| node.d/stiebeleltron | collector | - |
| node.d/named | collector | go.d/bind |
Support options
Supporting people in using and building with Netdata is very important to us! Should you need any help or encounter an issue with any of the changes made in this release, feel free to get in touch with the community through the following channels:
- GitHub: Report bugs or submit a new feature request.
- GitHub Discussions: Share your ideas, and be part of the Netdata Agent development process.
- Community forum: Collaborate with other troubleshooters in building a community-driven knowledge base around Netdata.
- Discord: Join us in celebrating the culture of infrastructure monitoring. Hang out with like-minded sysadmins, SREs, and troubleshooters.
Published by netdatabot over 2 years ago
Netdata v1.33.1 is a patch release to address issues discovered since v1.33.0.
This release contains bug fixes and documentation updates.
If you also use Netdata Cloud, please note that we started migrating nodes running on the old architecture to the new one. Most users don’t have to take any action on their part, but if you are affected by the migration, a banner will be added to your Cloud dashboard with a link to further instructions.
If you love Netdata and haven't yet considered giving us a Github star, we would appreciate for you to do so!
Acknowledgments
- @petecooper for fixing a typo and improving the installer script usage message.
- @mohammed90 for updating syntax for Caddy v2 in docker install guide.
Dashboard
- Add legacy protocol deprecation notification in the header (#12117)
- Fix handling of
afterandbeforeURL params in direct links (#12052)
Documentation
- Add a note that the Synology install guide is maintained by community (#12086, @ilyam8)
- Remove mention of libJudy in installation documentation for macOS (#12080, @vlvkobal)
- Make requirement of mounting the docker socket for containers name resolution explicit (#12079, @ilyam8)
- Cleanup installation docs (#12057, @kickoke)
- Improve Alerta readme (#11944, @kickoke)
- Fix unresolved file references (#12053, @ilyam8)
- Update the docs to match new installation script (#12042, @kickoke)
- Update syntax for Caddy v2 in docker install guide (#12092, @mohammed90)
- Fix paths to install boxes (#12109, @kickoke)
- Fix matching the new install box component name (#12106, @kickoke)
- Remove ACLK legacy documentation (#12103, @underhood)
- Add interactive kickstart scripts where possible (#12098, @kickoke)
Packaging / Installation
- Add native installation for Rocky linux (#12081, @maneamarius)
- Fix compilation errors for OpenSSL on macOS (#12048, @vlvkobal)
- Fix handling of non-x86 static builds in updater (#12055, @Ferroin)
- Fix handling of removed packages with leftover config files in installer (#12033, @Ferroin)
- Improve the installer script usage message (#12062, @petecooper)
- Add proper support for Oracle Linux native packages to installer (#12101, @Ferroin)
- Fix handling of Oracle Linux repoconfig packages (#12100, @Ferroin)
- Fix handling non-interactive installs as non-root users (#12089, @Ferroin)
- Add info about installer interactivity to anonymous installer telemetry events (#12088, @Ferroin)
- Make the netdata-installer script Posix compliant (#11961, @maneamarius)
- Make a lack of an os-release file non-fatal on install (#12087, @Ferroin)
Bug Fixes
- Fix compilation errors cased by including "lz4.h" when stream compression is disabled (#12049, @odynik)
- Disable ebpf socket thread causing crashes on some systems (#12085, @thiagoftsm)
- Fix ACLK reconnect endless loop (#12074, @underhood)
- Fix compilation errors when openssl is not available and compiling with --disable-https and --disable-cloud (#12071, @MrZammler)
Other Notable Changes
- Adds legacy protocol deprecation banner to agent log (#12065, @underhood)
Support options
As we grow, we stay committed to providing the best support ever seen from an open-source solution. Should you encounter an issue with any of the changes made in this release or any feature in the Netdata agent, feel free to contact us by one of the following channels:
- Github: You can use our Github repo to report bugs or open a new feature request.
- Github Discussions: We are using Github discussions to document our development process so you can be a part of it.
- Community forum: You can visit our community forum for questions and training.
- Discord: You can jump into our Discord for interactive, synchronous help and discussion. More than 800 engineers are already using it! Join us!
Published by netdatabot over 2 years ago
Release v1.33.0
Happy New Year to everyone in the Netdata community. After one of our biggest releases ever, we have re-energized over the holidays and are ready to continue helping more people troubleshoot their infrastructure. Hopefully you've already heard about the improvements we made to the kickstart script. With this release, we're adding even more features:
- Netdata is now distributed as pre-built packages on many Linux distributions
- Stream compression (tech preview)
- eBPF CO-RE support
❗We're also keeping our codebase healthy by removing end-of-life features. Read the deprecation notice to check if you are affected.
If you love Netdata and haven't given us a yet Github star, please do, we would really appreciate it!
Netdata open-source Agent growth
The open-source Netdata Agent, the best OSS node monitoring and troubleshooting solution, currently has:
- 1,300,000 unique Netdata nodes live!
- An amazing adoption rate, with 3,300 new nodes per day!
- 280,000 Docker pulls per day with 375 million total, according to DockerHub!
Community news
Netdata is supported both by an active community of global contributors and the Netdata staff.
Get involved:
- Build with us on Netdata.
- Join us on Discord, and say hello.
- Contribute your knowledge with open GitHub issues.
- Launching soon, be on the lookout for our new monthly community awards
Release highlights
Netdata is now distributed as pre-built packages on many Linux distributions
We recently released a completely new version of our one-line installer code. Wherever available, our new kickstart script uses DEB or RPM packages provided by Netdata. These packages are tightly integrated with the package management system of the distribution, providing the best installation experience in a reliable and fast way.
Already over 70% of our new installations use DEB or RPM packages! The updated kickstart script has several advantages over the old one:
- It’s more advanced because it automatically selects the best supported installation method for your system. However, you can still explicitly ask for a specific type of installation method.
- It’s more convenient as it requires no manual installation of packages on a majority of systems.
- It’s more resource efficient on most systems, meaning less impact on your running workloads (and much faster installs on idle systems).
📄 Find the updated install documentation on our official docs site.
If you were using the old kickstart.sh script through a custom script or orchestration tool, you may need to update the options being passed to get it to behave like it used to (this will usually just involve adding --build-only to the options).
Other installation types do not need to make any changes because of this.
Stream compression (tech preview)
The Agent's streaming mechanism now supports stream compression. Streaming thousands of metrics between Netdata Agents increases your data availability and provides a more robust mechanism to monitor your metrics and troubleshoot problems.
Stream compression allows you to:
- Save up to 70% of bandwidth by reducing the size of transmitted metrics between Netdata Agents.
- Therefore, reduce costs over metered data connections by up to 70%.
- Take advantage of low-speed connections.
Stream compression uses the lossless "LZ4 - Extreme fast compression" library. It achieves compression speeds up to 800Mbps, decompression speeds up to 4500Mbps with an average compression ratio between 2.0 and 3.0. Because this is a technical preview and we are still working to make it amazing, stream compression will be disabled by default.
📄 Learn how to enable streaming between nodes.
📄 If you already stream between nodes, learn how to enable streaming compression
Note: Stream compression only works if all participating Netdata Agents are hosted on an OS which supports the library version lz4 v1.9.0+. If a Netdata Agent does not detect the lz4 v1.9.0+ library version, it will disable stream compression.
eBPF CO-RE support
In v1.32 we added some major improvements to our eBPF support. For this release, we’re taking the next step by gradually introducing BPF CO-RE support!
Today, the distribution of eBPF programs is very challenging, because trying to compile an eBPF program with so many different Linux kernels is so complex. We want to make eBPF widely available to everyone without worrying about compatibility. And here is where eBPF CO-RE (Compile Once, Run Everywhere), part of libbpf, comes to the rescue.
CO-RE is a modern approach to writing portable BPF applications that can run on multiple kernel versions and configurations without modifications and runtime source code compilation on the target machine. We now have the opportunity to focus on what matters, add more features, and improve performance of our eBPF offering!
Furthermore, in this release we also introduce two new eBPF charts:
- Threads info: Displays the total number of active eBPF threads and the number of all eBPF threads.
- Load info: Measures the number of eBPF threads running on legacy code or CO-RE.

Acknowledgments
We would like to thank our dedicated, talented contributors that make up this amazing community. The time and expertise that you volunteer is essential to our success. We thank you and look forward to continue to grow together to build a remarkable product.
- @NikolayS for various improvements of python.d/postgres collector.
- @Saruspete for fixing handling of port_rcv_data and port_xmit_data counters in proc/infiniband collector.
- @ardabbour for fix errors in exporting walkthrough.
- @avstrakhov for adding LZ4 streaming data compression.
- @boxjan for fixing permissions of plugins for static builds.
- @candrews for adding a note that Netdata is available on Gentoo.
- @cmd-ntrf for fixing claim node examples in kickstart(-64) documentation.
- @jsoref for fixing spelling.
- @laned130 for adding a missing expression operator to the health configuration reference.
- @lokerhp for fixing a typo in the dashboard_info.js.
- @neotf for adding memory usage chart to python.d/spigotmc collector.
- @pbouchez for adding bar1 memory usage chart to python.d/nvidia_smi collector.
- @scatenag for fixing collecting user statistics for LDAP users in python.d/nvidia_smi collector.
- @sourcecodes2 for adding channels support to PushBullet notification method.
- @bompus for fixing collecting replica set stats in go.d/mongodb collector.
Collectors
Improvements
- Prefer python3 if available (python.d) (#12001, @ilyam8)
- Add bar1 memory usage chart (python.d/nvidia_smi) (#11956, @pbouchez)
- Add a note that Netfilter's "new" and "ignore" counters are removed in the latest kernel (#11950, @ilyam8)
- Consider mat. views as tables in table size/count chart (python.d/postgres) (#11816, @NikolayS)
- Use block_size instead of 8*1024 (python.d/postgres) (#11815, @NikolayS)
Bug fixes
- Fix handling of port_rcv_data and port_xmit_data counters (proc/infiniband)(#11994, @Saruspete)
- Fix handling of decoding errors in ExecutableService (python.d) (#11979, @ilyam8)
- Fix lack of sufficient system capabilities (perf.plugin) (#11958, @vlvkobal)
- Fix Netfilter accounting charts priority (nfacct.plugin) (#11952, @ilyam8)
- Fix lack of sufficient system capabilities (nfacct.plugin) (#11951, @ilyam8)
- Fix collecting user statistics for LDAP users (python.d/nvidia_smi) (#11858, @scatenag)
- Fix tps decode, and add memory usage chart (python.d/spigotmc) (#11797, @neotf)
- Fix collecting replica set stats (go.d/mongodb) (#639, @bompus)
eBPF
Improvements
- Add ebpf.plugin informational charts and various optimizations (#11992, @thiagoftsm)
- Update libbpf library to v0.6.1 (#11865, @thiagoftsm)
Bug fixes
- Fix disabling specific ebpf collectors (#12014, @thiagoftsm)
- Fix cachestat on kernel 5.15.x (#11833, @thiagoftsm)
Health
- Add sending notifications to channels support to PushBullet (#11850, @sourcecodes2)
Streaming
- Add LZ4 streaming data compression (#11821, @avstrakhov)
Documentation
- Fix formatting in the streaming doc (#12026, @kickoke)
- Fix a typo in the python.d/mongodb readme (#12024, @cboydstun)
- Add a note that streaming compression is disabled by default (#12019, @odynik)
- Refine the idlejitter.plugin docs (#12012, @kickoke)
- Delete unused collectors quickstart guide (#12000, @kickoke)
- Delete duplicate getting started doc (#11978, @kickoke)
- Refine the python example for clarity (#11989, @kickoke)
- Add alternative install command for macOS (#11997, @Ferroin)
- Refine the bash example for clarity (#11990, @kickoke)
- Fix the statsd.plugin readme formatting (#11943, @kickoke)
- Update SNMPv3 documentation (#11959, @kickoke)
- Improve PagerDuty notification doc (#11147, @joelhans)
- Fix spelling (#10976, @jsoref)
- Fix tables side borders (#11923, @ilyam8)
- Fix claim node examples in kickstart(-64) documentation (#11242, @cmd-ntrf)
- Fix the title of exporting reference doc (#11252, @joelhans)
- Add a note with a link to guide for using on Pi (#11605, @andrewm4894)
- Add "==" to the list of health expression operators (#11905, @laned130)
- Fix errors in exporting walkthrough (#11902, @ardabbour)
- Fix unresolved file references (#11903, @ilyam8)
- Add missing dependencies for New Cloud Architecture (#11373, @underhood)
- Indicate availability on Gentoo (#7675, @candrews)
Packaging / Installation
- Fix cleanup from a failed DEB install (#12006, @Ferroin)
- Update go.d.plugin version to v0.31.2 (#12005, @ilyam8)
- Fix handling of static archive selection for installs. (#12004, @Ferroin)
- Fix install prefix handling for claiming code in new kickstart script (#11999, @Ferroin)
- Fix the updater script checksum validation for static builds (#11986, @ilyam8)
- Fix retrieving service commands without failure (#11947, @maneamarius)
- Fix getting the latest tag in the updater script (#11908, @maneamarius)
- Fix handling of agent restart on update. (#11887, @Ferroin)
- Fix permissions of plugins that may be built (#11877, @boxjan)
- Fix the code that checks for available updates. (#11870, @Ferroin)
- Initial release of new kickstart script (#11764, @Ferroin)
- Add support to updater for updating native DEB/RPM installs with our official packages (#11753, @Ferroin)
Other notable changes
Improvements
- Add install type info to
-W buildinfooutput. (#12010, @Ferroin) - Add support for NVME disks with blkext driver (#12007, @ralphm)
- Perform a host metadata update on child reconnection (#11965, @stelfrag)
- Send ML feature information with UpdateNodeInfo (#11913, @vkalintiris)
- Use absolute features when doing training/prediction. (#11876, @vkalintiris)
- Send the cloud protocol used to posthog (#11842, @MrZammler)
- Remove ACLK Legacy (#11841, @underhood)
Bug fixes
- Fix access to freed memory in ACLK (#12015, @underhood)
- Fix a typo in the dashboard_info.js spigot part (#12008, @lokerhp)
- Fix queue removed alerts (#11996, @MrZammler)
- Fix coverity 374746 (#11973, @MrZammler)
- Fix ACLK chart description (#11970, @underhood)
- Fix a broken link in dashboard_info.js (#11948, @Ancairon)
- Fix an error in configure.ac (#11937, @underhood)
- Fix handling of the "-url" parameter in the claiming script (#11919, @ilyam8)
- Fix time_t format (#11897, @vlvkobal)
- Fix compiling with AWS Kinesis support (#11867, @vlvkobal)
- Fix cmake build (#11862, @vlvkobal)
- Fix compilation warnings (#11846, @vlvkobal)
Code organization
- Remove internal dbengine header from spawn/spawn_client.c (#12009, @vkalintiris)
- Better handle creation of UUID for claiming (#11974, @Ferroin)
- Use libnetdata/required_dummies.h in collectors. (#11971, @vkalintiris)
- Do not use dbengine headers when dbengine is disabled. (#11967, @vkalintiris)
- Use libnetdata/required_dummies.h in collectors. (#11971, @vkalintiris)
- Do not use dbengine headers when dbengine is disabled. (#11967, @vkalintiris)
- Perform a host metadata update on child reconnection (#11965, @stelfrag)
- Remove bitfields from rrdhost. (#11964, @vkalintiris)
- Update libmongoc CMake config (#11962, @vlvkobal)
- Find host and pass host->health_enabled to cloud AlarmLogHealth message (#11960, @MrZammler)
- Compute platform-specific list of static_threads at runtime. (#11955, @vkalintiris)
- Blocking publish and in flight buffer regrowth (#11932, @underhood)
- Try to find worker config thread from inactive threads for new architecture (#11928, @MrZammler)
- Handle re-claim while the agent is running in new architecture (#11924, @MrZammler)
- Include libatomic to allow protobuf to resolve __atomic functions (#11917, @MrZammler)
- Provide runtime ml info from a new endpoint (#11886, @vkalintiris)
- Update dependencies for the pubsub exporting connector (#11872, @vlvkobal)
- Remove ACLK-NG 'cmd' switch by message type (#11866, @underhood)
- Optimize rx msg name resolution (#11811, @underhood)
- Add localhost hostname to the edit_command (#11793, @MrZammler)
Deprecation notice
The following items will be removed in our next release:
- backends subsystem. Has been replaced by the exporting engine.
- node.d/fronius collector. Will be moved to the netdata/community repository.
- node.d/sma_webbox collector. Will be moved to the netdata/community repository.
- node.d/stiebeleltron collector. Will be moved to the netdata/community repository.
- node.d/named collector. Has been replaced by go.d/bind. Will be moved to the netdata/community repository.
Deprecated in this release
Following our previous deprecation notice legacy ACLK support is officially removed in this release. See more information in our last release notes (v1.32).
Support options
As we grow, we stay committed to providing the best support ever seen from an open-source solution. Should you encounter an issue with any of the changes made in this release or any feature in the Netdata agent, feel free to contact us by one of the following channels:
- Github: You can use our Github repo to report bugs.
- Community forum: You can visit our community forum for questions and training.
- Discord: You can jump into our Discord for interactive, synchronous help and discussion. More than 800 engineers are already using it! Join us!
Published by netdatabot almost 3 years ago
Netdata v1.32.1
Netdata v.1.32.1 is a patch release to address issues discovered since 1.32.0.
This release contains bug fixes and documentation updates, including clarified instructions for ACLK and our Machine Learning (ML) functionality.
We appreciate our community's help in identifying and diagnosing these issues so we could fix them quickly.
We encourage users to upgrade to the latest version at their earliest convenience.
Acknowledgments
- @boxjan For providing a fix to correctly pass arguments in static builds.
Documentation
- Clean up anomaly-detection guide docs (#11901, @andrewm4894)
- Add Swagger docs for new
/api/v1/aclkendpoint (#11881, @underhood) - Minor ACLK documentation updates (#11882, @underhood)
- Add z score alarm example (#11871, @andrewm4894)
- Create ML README.md (#11848, @andrewm4894)
- Update nightly badge link (#11843, @ilyam8)
Packaging / Installation
- Fix postdrop handling for systemd systems. (#11885, @Ferroin)
- Don't produce output when static update succeeded (#11879, @ilyam8)
- Make netdata-updater.sh POSIX compliant. (#11755, @Ferroin)
- Fix exit code when updating static install && updater script (#11873, @ilyam8)
- Fix passing of extra arguements in static builds (#11852, @boxjan)
- Explicitly conflict with distro netdata DEB packages. (#11855, @Ferroin)
- Bump static builds to use Alpine 3.15 as a base. (#11836, @Ferroin)
- Detect whether libatomic should be linked in when using CXX linker. (#11818, @vkalintiris)
- Fix token name in release draft workflow. (#11847, @Ferroin)
- Remove OpenSUSE Leap 15.2 from CI. (#11600, @Ferroin)
- Remove Fedora 33 from CI. (#11640, @Ferroin)
Bug Fixes
Published by Ferroin almost 3 years ago
Release v1.32.0
The newest version of Netdata, v.1.32.0, propels us toward the end of the year, and the Netdata community is positioned to grow stronger than ever in 2022. Before we get into specifics of the new release, it's worth reflecting on that growth.
Netdata open-source Agent growth
The open-source Netdata Agent, the best OSS node monitoring and troubleshooting ever, currently has:
- 1,000,000 unique Netdata nodes live!
- 330,000 engineers using the agent per month!
- Our open-source community growing at an amazing rate, with 3,000 new nodes and 8,000 users per day!
- 250,000 Docker pulls per day with 360 million total, according to DockerHub!
Netdata Cloud growth
The Netdata Cloud, our infrastructure-level, distributed, real-time monitoring and troubleshooting orchestrator, is also showing similar growth, with:
- 35,000 live Netdata nodes!
- 90,000 engineers signed up with 200 new sign-ups every day!
- 180 new spaces created every day!
We are not just pleased with this amazing adoption rate, we are inspired by it. It is you users who give us the energy and confidence to move forward into a new era of high-fidelity, real-time monitoring and troubleshooting, made accessible to everyone!
Thank you for the inspiration! You rock!
Community News
As many of you know, even though we are not endorsed by CNCF, Netdata is the fourth most starred project in the CNCF landscape. We want to thank you for this expression of your appreciation. If you love Netdata and haven't yet, consider giving us a Github star.
Additionally, we invite you to join us on our new Discord server to continue our growth and trajectory, but also to join in on fun and informative live conversations with our wonderful community.
v1.32.0 at a glance
The following offers a high-level overview of some of the key changes made in this release, with more detailed description available in subsequent sections.
New Cloud backend and Agent communication protocol
This Agent release supports our new Cloud backend. From here, we will be offering much faster and simpler communication, reliable alerts and exchange of metadata, and first-time support for the parent-child relationship of Netdata agents. This is the first Agent release that allows Netdata Cloud to use the Netdata Agent as a distributed time-series database that supports replication and query routing, for every metric!
eBPF latency monitoring, container monitoring, and more
We use eBPF to monitor all running processes, without the cooperation of the processes and without sniffing data traffic. This new release includes 13 new eBPF monitoring features, including I/O latency, BTRFS, EXT4, NFS, XFS and ZFS latencies, IRQs latencies, extended swap monitoring, and more.
Machine learning (ML) powered anomaly detection
This release links Netdata Agent with dlib, the popular C++ machine learning algorithms library, which we use to automatically detect anomalies out-of-the-box, at the edge! Once enabled, Netdata trains an ML model for every metric, which is then used to detect outliers in real-time. The resulting "anomaly bit" (where 0=normal, 1=anomalous) associated with each database entry is stored alongside the raw metric value with zero additional storage overhead! This feature is still in development, so it is disabled by default. If you would like to test it and provide feedback, you can enable the feature using the instructions provided in the Detailed release highlights section.
New timezone selector and time controls in the user interface
We implemented a new timezone picker and time controls to enhance administrative abilities in the dashboard.
Docker image POWER8+ support
Netdata Docker images now support recent IBM Power Systems, Raptor Talos II, and more.
And more...
Four new collectors, 112 total improvements, 95 bug fixes, 49 documentation updates, and 57 packaging and installation changes!
Detailed release highlights
New Cloud backend and Agent communication protocol
It's no secret that the best of Netdata Cloud is yet to come. After several months of developing, testing, and benchmarking a new architectural system, we have steadied ourselves for that growth. These changes should offer notable and immediate improvements in reliability and stability, but more importantly, they allow us to quickly and efficiently develop new features and enhanced functionality. Here's what you can look for on the short-term horizon, thanks to our new architecture:
- Greater capacity: The new architecture will change the communication protocol between the Agent and the Cloud to be incremental, improving our agent-handling capacity by ensuring that the Cloud uses measurably less bandwidth.
- Parent/child relationships: The new architecture will allow, for the first time, the recognition of parent child relationships in the Cloud. These changes will enable you to change storage configuration on parents, limit sent metrics, and reduce data frequency to achieve a longer data retention for your nodes. Atop of this, we will continue to develop the ability for you to have complex setups to scale your monitoring with parents as proxies. Ultimately, this will enable Netdata to operate as a headless connector with the lowest footprint possible on your production nodes.
- Alerts: The new architecture will host a multitude of improvements on our alerts presentation over the coming months, allowing for enhanced reliability, alert management, alert logs to be collected in the Cloud, and more.
If you would like to be among the first to test this new architecture and provide feedback, first make sure that you have installed the latest Netdata version following our guide. Then, follow our instructions for enabling the new architecture.
eBPF container monitoring
We did a lot of work to enhance our eBPF container monitoring this release. First, we start with the development of full eBPF support for cgroups. As a refresher on just how important this update is: cgroups together with Namespaces are the building blocks for containers, which is the dominant way of distributing monitoring applications. We use cgroups to control how much of a given key resource (CPU, memory, network, and disk I/O) can be accessed or used by a process or set of processes. Our eBPF collector now creates charts for each cgroup, which enables us to understand how a specific cgroup interacts with the Linux kernel! 🤓
This enhances our already extensive monitoring by including cgroups for mem, process, network, file access, and more.
eBPF latency monitoring
By enabling eBPF monitoring on all systems that support it, Netdata has already been established as a world-leading distributor of eBPF! We use eBPF to monitor all running processes, without the cooperation of the processes, by tracking any way the application interfaces with the system. And in this release, we continue our commitment to further improve eBPF by tracking latencies by disks, IRQs, etc.
Our new eBPF latency features include:
- A new set of Disk I/O latency charts, which monitor the time that it takes for an I/O request to complete. As many of you may know, this is the most important metric for storage performance!
- Latency IRQs monitoring to help anyone with time spent servicing interrupts (hard or soft).
- A new Filesystem submenu that adds latency monitoring for different filesystems: BTRFS, Ext4, NFS, XFS and ZFS. The latency monitoring was brought for the most common functions, like latency for each open request and latency for each sync request.
eBPF is a very strong addition to our monitoring tools, and we are committed to provide the best experience with monitoring with eBPF from a distance without disrupting the data flow!
Other eBPF enhancements
But we didn't stop there with eBPF in v1.32.0. We also provided the following updates:
- We moved VFS to a Filesystem menu to simplify the visualization of events realized by filesystems. This allows you to monitor actions of filesystems and their latency.
- Until now, Netdata had metrics that demonstrated the amount of swap usage. eBPF.plugin now extends the swap monitoring to show how a specific application group/cgroup is performing action on SWAP.
- We have improved process management monitoring by adding monitoring to shared memory and using tracepoints to monitor process creation and exit with more accuracy.
- Netdata also brings monitoring for OOM Kill events for each apps groups defined on host.
If you share our interest in eBPF monitoring, or have questions or requests, feel free to drop by our Community forum to start a discussion with us.
Machine learning (ML) powered anomaly detection
Machine learning (ML) is undeniably a wave of the future in monitoring and troubleshooting. The Netdata community is riding that wave forward together, ahead of everyone else. Netdata v.1.32.0 introduces some foundational capabilities for ML-driven anomaly detection in the agent. We have integrated the popular dlib c++ ml library to power unsupervised anomaly detection out-of-the-box.
While this functionality is still under development and subject to change, we want to develop this with you, as a team. The functionality is disabled by default while we dogfood the feature internally and build additional ML-leveraging features into Netdata Cloud. But you can go to the new [ml] section in netdata.conf and set enabled=yes to turn on anomaly detection. After restarting Netdata, you should see the Anomaly Detection menu with charts highlighting the overall number and percent of anomalous metrics on your node. This can be a very useful single number summary of the state of your node.
Share your feedback by emailing us at [email protected] or just come hang out in the 🤖-ml-powered-monitoring channel of our discord, where we discuss all things ML and more!
And then, be on the lookout for some bigger announcements and launches relating to ML over the next couple of months.
New timezone selector and time controls in the user interface
Collaborating in a remote world across regions can be difficult, so we wanted to make it easier for you to sync with your administrative teams and your system information. Our new timezone selector allows you to select a timezone to accommodate collaboration needs within your teams and infrastructure. Additionally, we have added the following time controls to allow you to distinguish if the content you are looking at is live or historical and to refresh the content of the page when the tabs are in the background:
- Play: When this option is selected, the content of the page will be automatically refreshed while this is in the foreground.
- Pause: When this option is selected, the content of the page will not refresh due to a manual request to pause it or, for example, when you are investigating data on a chart (cursor is on top of a chart)
- Force Play: When this option is selected, the content of the page will be automatically refreshed even if this is in the background.
Docker image POWER8+ support
And on top of all of that, we have added 64-bit little-endian POWER8+ support to our official Docker images, allowing the use of Netdata Docker images on recent IBM Power Systems, Raptor Talos II, and similar POWER based hardware, extending the list of what is currently supported for our Docker images, which includes:
- 32 and 64 bit x86
- ARMv7
- AArch64
Acknowledgments
- @nabijaczleweli for fixing writing updater log under root.
- @MikaelUrankar for fixing calculation of sysctl mib size in freebsd plugin.
- @filip-plata for adding additional metrics to python.d/postgres collector.
- @eltociear for fixing typos.
- @gotjoshua for adding a link to python.d/httpcheck.conf.
- @wangpei-nice for fixing ebpf.plugin segfault when ebpf_load_program returns null pointer.
- @zanechua for adding Microsoft Teams to supported notification endpoints.
- @diizzyy for adding support for Intel 2.5G and Synopsys DesignWare nic driver in freebsd plugin.
- @Saruspete for fixing handling of adding slabs after discovery in slabinfo plugin.
- @mjtice for adding autovacuum and tx wraparound charts to python.d/postgres.
- @charoleizer for adding PostgreSQL version to requirements section.
- @danmichaelo for fixing a typo in exporting docs.
- @oldgiova for adding capsh check before issuing setcap cap_perfmon.
- @oldgiova for adding Travis ctrl file for checking if changes happened.
- @0x3333 for fixing an inconsistent status check in charts.d/apcupsd.
- @etienne-napoleone for adding terra related binaries to blockchains apps plugin group.
- @anayrat for fixing postgres replication_slot chart on standby.
- @vpiserchia for fixing handling of null values returned by _cat/indices API in python.d/elasticsearch.
- @elelayan for fixing zpool state parsing in proc/zfs.
- @steffenweber for adding missing privilege to fix MySQL slave reporting.
- @unhandled-exception for adding sorting of the list of databases in alphabetical order in python.d/postgres.
- @78Star for updating Netdata and its dependencies versions for pfSense.
- @unhandled-exception for fixing crashing of the wal query if wal-file was removed concurrently in python.d/postgres.
- @rupokify for updating jQuery dependency.
- @caleno for fixing a typo in streaming docs.
- @rex4539 for fixing typos.
Dashboard
- Add various updates to dashboard info (#11639, @ilyam8)
- Add timex plugin chart descriptions (#11635, @ilyam8)
- Add proc plugin zfs chart descriptions (#11630, @ilyam8)
- Add proc plugin infiniband chart descriptions (#11628, @ilyam8)
- Add proc plugin pagetypeinfo chart descriptions (#11627, @ilyam8)
- Add proc plugin net_wireless chart descriptions (#11626, @ilyam8)
- Add proc plugin net_rpc_nfs and net_rpc_nfsd chart descriptions (#11625, @ilyam8)
- Add proc plugin power_supply chart descriptions (#11619, @ilyam8)
- Add cgroups plugin systemd services chart descriptions (#11618, @ilyam8)
- Add cgroups plugin chart descriptions (#11607, @ilyam8)
- Add apps plugin chart descriptions (#11601, @ilyam8)
- Add proc plugin vmstat chart descriptions (#11597, @ilyam8)
- Add proc plugin ksm chart descriptions (#11595, @ilyam8)
- Add proc plugin edac chart descriptions (#11589, @ilyam8)
- Add proc plugin stat chart descriptions (#11586, @ilyam8)
- Add proc plugin net_stat_synproxy chart descriptions (#11581, @ilyam8)
- Add proc plugin softirqs chart descriptions (#11577, @ilyam8)
- Add proc plugin net_stat_conntrack chart descriptions (#11576, @ilyam8)
- Add proc plugin uptime chart descriptions (#11569, @ilyam8)
- Add proc plugin net_sockstat and net_sockstat6 chart descriptions (#11567, @ilyam8)
- Add proc plugin net_snmp6 chart descriptions (#11565, @ilyam8)
- Add proc plugin net_sctp_snmp chart descriptions (#11564, @ilyam8)
- Add proc plugin net_snmp chart descriptions (#11557, @ilyam8)
- Add proc plugin net_netstat chart descriptions (#11554, @ilyam8)
- Add proc plugin net_ip_vs_stats chart descriptions (#11546, @ilyam8)
- Add proc plugin net_dev chart descriptions (#11543, @ilyam8)
- Add proc plugin meminfo chart descriptions (#11541, @ilyam8)
- Add proc plugin mdstat chart descriptions (#11537, @ilyam8)
- Add proc plugin interrupts chart descriptions (#11532, @ilyam8)
- Add proc plugin diskstats chart descriptions (#11528, @ilyam8)
- Add proc plugin ipc semaphores chart descriptions (#11523, @ilyam8)
- Remove 'vernemq.queue_messages_in_queues' from dashboard info (#11403, @ilyam8)
- Move MD arrays charts under Disks (#11119, @thiagoftsm)
Collectors
New
- Add Traefik collector (go.d/traefik) (#605, @ilyam8)
- Add HAProxy collector (go.d/haproxy) (#599, @ilyam8)
- Add Mongodb collector (go.d/mongodb) (#598, @georgeok)
- Add Ethereum Node collector (go.d/geth) (#585, @odyslam)
Improvements
- Add AWS to apps_groups.conf (#11826, @ilyam8)
- Show stats for systemd protected mount points (diskspace plugin) (#11767, @vlvkobal)
- Add support for v1.7.0+ (go.d/coredns) (#619, @georgeok)
- Add "/basic_status" job nginx.conf (go.d/nginx) (#612, @ilyam8)
- Add sharding metrics (go.d/mongodb) (#609, @georgeok)
- Add thread operations metrics (go.d/mysql) (#607, @ilyam8)
- Add replica sets metrics (go.d/mongodb) (#604, @georgeok)
- Add databases metrics (go.d/mongodb) (#602, @georgeok)
- Add more OS(OperatingSystem) charts (go.d/wmi) (#593, @ilyam8)
- Add caddy job to prometheus.conf (go.d/prometheus) (#581, @odyslam)
- Add AOF file size metrics (go.d/redis) (#578, @ilyam8)
- Add openethereum/geth jobs to prometheus.con (go.d/prometheus) (#578, @odyslam)
- Update whois/whois-parser packages and add timeout configuration option (go.d/whoisquery) (#576, @ilyam8)
- Disable reporting min/avg/max group uptime by default (apps plugin) (#11609, @ilyam8)
- Add sorting of the list of databases in alphabetical order (python.d/postgres) (#11580, @unhandled-exception)
- Add terra related binaries to blockchains group (apps plugin) (#11437, @etienne-napoleone)
- Add instruction per cycle charts (perf plugin) (#11392, @thiagoftsm)
- Add autovacuum and tx wraparound charts (python.d/postgres) (#11267, @mjtice)
- Add support for Intel 2.5G and Synopsys DesignWare nic driver (freebsd plugin) (#11251, @diizzyy)
- Add web3 and blockchains groups (apps plugin) (#11220, @odyslam)
- Implement merging user/stock configuration files (python.d plugin) (#11217, @ilyam8)
- Rename default job from 'local' to 'anomalies' (python.d/anomalies) (#11178, @andrewm4894)
- Add standby lag and blocking transactions charts (python.d/postgres) (#11169, @filip-plata)
Bug fixes
- Fix renaming for cgroups with dots in the path (cgroups plugin) (#11775, @vlvkobal)
- Fix exiting on SIGPIPE (go.d plugin) (#630, @ilyam8)
- Fix domain syntax validation (go.d/whoisquery) (#629, @ilyam8)
- Fix missing NONE in valid request methods (go.d/squidlog) (#621, @ilyam8)
- Remove wrong "queue_messages_in_queues" chart (go.d/vernemq) (#601, @ilyam8)
- Fix HTTP/socket client initialization order (go.d/phpfpm) (#591, @ilyam8)
- Fix scraping metrics when resources are not discovered (go.d/vsphere) (#589, @ilyam8)
- Fix LTSV log format parsing (go.d/weblog) (#584, @ilyam8)
- Fix expiration date parsing (go.d/whoisquery) (#575, @ilyam8)
- Fix containers name resolution for crio/containerd runtime (cgroups plugin) (#11756, @ilyam8)
- Add sensors to charts.d.conf and add a note on how to enable it (charts.d plugin) (#11715, @ilyam8)
- Fix crashing of the wal query if wal-file was removed concurrently (python.d/postgres) (#11697, @unhandled-exception)
- Fix "lsns: unknown column" logging (cgroups plugin) (#11687, @ilyam8)
- Fix nfsd RPC metrics and remove unused nfsd charts and metrics (proc/nfsd) (#11632, @vlvkobal)
- Fix "proc4ops" chart family (proc/nfsd) (#11623, @ilyam8)
- Fix swap size calculation (cgroups plugin) (#11617, @vlvkobal)
- Fix RSS memory counter for systemd services (cgroups plugin) (#11616, @vlvkobal)
- Fix VBE parsing (python.d/varnish) (#11596, @ilyam8)
- Remove unused synproxy chart (proc/synproxy) (#11582, @vlvkobal)
- Fix zpool state parsing (proc/zfs) (#11545, @elelayan)
- Fix null values returned by '_cat/indices' API (python.d/elasticsearch) (#11501, @vpiserchia)
- Fix replication_slot chart on standby (python.d/postgres) (#11455, @anayrat)
- Fix an inconsistent status check (charts.d/apcupsd) (#11435, @0x3333)
- Fix plugin name (stats.d plugin) (#11400, @vlvkobal)
- Fix plugin names (freebsd and macos plugins) (#11398, @vlvkobal)
- Fix lack of "module" in chart definition (all chart.d modules) (#11390, @ilyam8)
- Fix various python modules charts contexts (python.d/smartd_log, mysql, zscores) (#11310, @ilyam8)
- Fix current operation charts title and context (proc/mdstat) (#11289, @ilyam8)
- Fix handling of adding slabs after discovery (slabinfo plugin) (#11257, @Saruspete)
- Fix calculation of sysctl mib size (freebsd plugin) (#11159, @MikaelUrankar)
eBPF
New
- Add MD flush calls tracking (#11681, @UmanShahzad)
- Add shared memory system calls tracking (#11560, @UmanShahzad)
- Add OOM kills tracking (#11470, @UmanShahzad)
- Add soft IRQ latency tracking (#11445, @UmanShahzad)
- Add hard IRQ latency tracking (#11410, @UmanShahzad)
- Add mount/umount calls tracking (#11358, @thiagoftsm)
- Add btrfs latency monitoring (#11348, @thiagoftsm)
- Add ZFS latency monitoring (#11330, @thiagoftsm)
- Add NFS latency monitoring (#11313, @thiagoftsm)
- Add disk latency monitoring (#11276, @thiagoftsm)
- Add XFS latency monitoring (#11238, @thiagoftsm)
- Add ext4 latency monitoring (#11224, @thiagoftsm)
- Add extended swap monitoring (#11090, @thiagoftsm)
Improvements
- Add (eBPF) to submenu (#11721, @thiagoftsm)
- Process monitoring cleanup and improvements (#11643, @thiagoftsm)
- Add integration with cgroups plugin (socket, shared memory, cachestat) (#11642, @thiagoftsm)
- Add integration with cgroups plugin (process, file descriptor, VFS, directory cache and OOMkill) (#11611, @thiagoftsm)
- Add initial integration with cgroups plugin (swap) (#11573, @thiagoftsm)
- Add integration with cgroups plugin (create shared memory with cgroups) (#11559, @thiagoftsm)
- Update charts descriptions (#11547, @thiagoftsm)
- Convert eBPF submenus to lowercase (#11511, @thiagoftsm)
- Socket monitoring code improvements and update charts descriptions (#11441, @thiagoftsm)
- Move file operation monitoring to a separate thread (#11401, @thiagoftsm)
- Add module names for threads (#11387, @thiagoftsm)
- Move repeating part of latency chart descriptions to the family level (#11363, @thiagoftsm)
- Reduce plugin's memory usage (#11256, @thiagoftsm)
- Assorted improvements and fixes (#11230, @thiagoftsm)
- Move VFS monitoring to a separate threads and add new charts (#11187, @thiagoftsm)
Bug fixes
- Fix command line arguments (#11670, @thiagoftsm)
- Fix hardirq/softirq value init logic (#11471, @UmanShahzad)
- Fix VFS index reference (#11356, @thiagoftsm)
- Fix a case when multiple eBPF plugins are running (#11287, @thiagoftsm)
- Fix applying configuration options (#11253, @thiagoftsm)
- Fix a segfault when ebpf_load_program returns null pointer (#11203, @wangpei-nice)
- Fix a wrong pointer to a function and move parser to main thread (#11152, @thiagoftsm)
Health
Improvements
- Remove pihole_blocked_queries alert (#11829, @Ancairon)
- Improve check for supported -F parameter in sendmail (#11506, @MrZammler)
- Add custom e-mail headers (#11454, @MrZammler)
- Add 'cockroachdb_underreplicated_ranges' alarm (#11360, @ilyam8)
- Disable 'oom_kill' alarm on k8s nodes (#11359, @ilyam8)
- Add geth stock alarms (#11341, @odyslam)
- Remove pythond modules specific last_collected alarms (#11307, @ilyam8)
- Remove CockroachDB deprecated alarms (#11235, @ilyam8)
- Add new email notification template (#11219, @MrZammler)
- Add system clock synchronization state alarm (#11177, @ilyam8)
- Add python.d/go.d jobs last_collected_secs alarms (#11168, @ilyam8)
- Make stocks alarms less sensitive (#11153, @ilyam8)
Bug fixes
- Fix swap_used alarm calculation (#11672, @ilyam8)
- Fix ram level alarms (#11452, @ilyam8)
- Fix 'gearman_workers_queued' alarm (#11361, @ilyam8)
- Fix sending MS Teams notifications to multiple channels (#11355, @ilyam8)
- Fix sendmail 'unrecognized option: F' issue (#11283, @MrZammler)
- Update old logo to new one (#11263, @odyslam)
- Swap class and type attributes in stock alarm configurations (#11240, @MrZammler)
- Fix alarm line 'charts' matching (#11204, @ilyam8)
Documentation
- Updating ansible steps for clarity (#11823, @kickoke)
- Add a note about pkg-config file location for freeipmi (#11831, @vlvkobal)
- Fix broken link in charts.mdx (#11808, @DShreve2)
- Fix typos (#11782, @rex4539)
- Add nightly release version to readme (#11780, @andrewm4894)
- Fix link to new charts (#11773, @DShreve2)
- Fix typos in netdata-security.md (#11772, @jlbriston)
- Update eBPF documentation (Filesystem and HardIRQ) (#11752, @UmanShahzad)
- Add command for new health entity file (#11733, @DShreve2)
- Remove dated contact suggestion (#11732, @DShreve2)
- Add documentation about Filesystem and HardIRQ (#11752, @UmanShahzad)
- Fix a typo in streaming docs (#11747, @caleno)
- Update eBPF documentation (#11741, @thiagoftsm)
- Fix broken link - Charts 2.0 (#11729, @DShreve2)
- Fix broken link - eBPF plugin (#11728, @DShreve2)
- Add Cloud sign-up link (#11714, @DShreve2)
- Update claiming instructions for Docker (#11713, @DShreve2)
- Fix broken links in kickstart.md (#11708, @DShreve2)
- Add missing collectors to the eBPF plugin readme (#11703, @thiagoftsm)
- Fix broken link - Charts 2.0 (#11701, @hugovalente-pm)
- Update Netdata and dependencies versions for pfSense (#11674, @78Star)
- Add a note about new release of charts on the Cloud (#11637, @hugovalente-pm)
- Update optional parameters for upcoming installer (#11604, @DShreve2)
- Add missing privilege to fix MySQL slave reporting (#11574, @steffenweber)
- Fix broken links (#11540, @ilyam8)
- Update london demo to point at london3 (#11533, @andrewm4894)
- Add a note about handling backslashes in health configuration files (#11527, @ilyam8)
- Improve streaming documentation wording (#11510, @siamaktavakoli)
- Fix a typo in claiming docs (#11492, @car12o)
- Remove broken link (#11482, @andrewm4894)
- Add a note on how to find web files directory for custom dashboards (#11461, @ilyam8)
- Update "Install Netdata on Synology" guide (#11449, @ilyam8)
- Update installation documentation (#11442, @hugovalente-pm)
- Update eBPF documentation (#11440, @thiagoftsm)
- Add time controls and timezone selector description (#11433, @hugovalente-pm)
- Fix broken links - Custom dashboards (#11413, @hugovalente-pm)
- Fix broken links - Custom dashboards (#11405, @hugovalente-pm)
- Rename claiming action to connect (#11378, @hugovalente-pm)
- Fix a typo in exporting docs (#11376, @danmichaelo)
- Add PostgreSQL version to requirements section (#11328, @charoleizer)
- Minor fixes (#11320, @UmanShahzad)
- Fix prometheus node CPU alert rule (#11309, @ilyam8)
- Updated get-started.mdx (#11303, @jlbriston)
- Add Legacy/NG ACLK documentation (#11243, @underhood)
- Add links to data privacy page (#11226, @joelhans)
- Add Microsoft Teams to supported notification endpoints (#11205, @zanechua)
- Add a link to python.d/httpcheck.conf (#11182, @gotjoshua)
- Fix broken links (#11175, @joelhans)
- Update news about the latest release (#11165, @joelhans)
Packaging / Installation
- Use pip3 when installing git-semver package (#11817, @maneamarius)
- Add POWER8+ static builds (#11802, @Ferroin)
- Update libbpf to v0.5.1 (#11800, @thiagoftsm)
- Verify checksums of makeself deps (#11791, @vkalintiris)
- Update go.d.plugin version to v0.31.0 (#11789, @ilyam8)
- Add Oracle Linux 8 to CI and package builds (#11776, @Ferroin)
- Fix a typo in installation script (#11766, @ShimonOhayon)
- Update dashboard to v2.20.11 (#11743)
- Minor improvement to CPU number function regarding macOS. (#11746, @iigorkarpov)
- Add log grouping in installer and static build code when running under GitHub Actions. (#11720, @Ferroin)
- Add basic telemetry to the new kickstart script. (#11718, @Ferroin)
- Add eBPF plugin to static binaries (#11709, @thiagoftsm)
- Fix libbpf handling in RPM package builds. (#11702, @Ferroin)
- Don't use api.github.com when checking for latest stable version (#11700, @ilyam8)
- Fix handling of disabling telemetry in static installs. (#11689, @Ferroin)
- Mark g++ for freebsd as NOTREQUIRED (#11678, @MrZammler)
- Optimize static build and update various dependencies. (#11660, @Ferroin)
- Improve installation on systems with limited RAM. (#11658, @Ferroin)
- Add support for local builds to the new kickstart script. (#11654, @Ferroin)
- Explicitly opt out of LTO in RPM builds. (#11644, @Ferroin)
- Add flag to mark containers as created from official images in analytics. (#11606, @Ferroin)
- Add POWER8+ support to our official Docker images. (#11592, @Ferroin)
- Disable eBPF compilation in different platforms (#11566, @thiagoftsm)
- Fix installer flag --use-system-protobuf (#11539, @underhood)
- Re-add EPEL on CentOS 7. (#11525, @Ferroin)
- Use the correct exit status for the updater with static updates. (#11520, @Ferroin)
- Remove
reset_netdata_trace.shfrom netdata.service (#11517, @ilyam8) - Install basic netdata deps by default. (#11508, @Ferroin)
- Fix handling of claiming in kickstart script when running as non-root. (#11507, @Ferroin)
- Use system copy of protobuf in Docker images and static builds. (#11496, @Ferroin)
- Add initial implementation of new kickstart script. (#11493, @Ferroin)
- Add static builds for ARMv7l and ARMv8a (#11490, @Ferroin)
- Add the ability to allow arbitrary options to be passed to make from netdata-installer.sh. (#11479, @Ferroin)
- Embed build architecture in static build archive names. (#11463, @Ferroin)
- Fix edge repository configuration DEB packages. (#11458, @Ferroin)
- Add check for failed protobuf configure or make (#11450, @MrZammler)
- Don’t bail early if we fail to build cloud deps with required cloud. (#11446, @Ferroin)
- Change default to not using LTO for builds. (#11432, @Ferroin)
- Use DebHelper compat level 9 in repoconfig packages to support Ubuntu 16.04 (#11426, @Ferroin)
- Add capsh check before issuing setcap cap_perfmon (#11386, @oldgiova)
- Update handling of builds of bundled dependencies. (#11375, @Ferroin)
- Add support for bundling protobuf as part of the install. (#11374, @Ferroin)
- Properly handle eBPF plugin in RPM packages. (#11362, @Ferroin)
- Add support for claiming existing installs via kickstarter scripts. (#11350, @Ferroin)
- Assorted kickstart install fixes. (#11342, @Ferroin)
- Add aclk-schemas to dist_noinst_DATA (#11338, @underhood)
- Auto-detect PGID in Dockerfile's ENTRYPOINT script (#11274, @odyslam)
- Add code for repository configuration packages. (#11273, @Ferroin)
- Explicitly update libarchive on CentOS 8 when installing dependencies. (#11264, @Ferroin)
- Fix kickstart-static64.sh install script fail when trying to access
.install-typebefore it is created (#11262, @ilyam8) - Add openSUSE 15.3 package builds. (#11259, @Ferroin)
- Fix libjudy installation on CentOS 8. (#11248, @Ferroin)
- Fix
install_typedetection during update (#11199, @ilyam8) - Store info about the installation type for later retrieval. (#11157, @Ferroin)
- Compile/Link with absolute paths for bundled/vendored deps. (#11129, @vkalintiris)
- Fix writing updater log under root (#10901, @nabijaczleweli)
- Add ARM binary package builds to CI. (#10769, @Ferroin)
Other Notable Changes
Improvements
- Clean compilation warnings (#11810, @stelfrag)
- Fix coverity issues (#11809, @stelfrag)
- Add commands to check and fix database corruption (#11828, @stelfrag)
- Use two digits after the decimal point for the anomaly rate. (#11804, @vkalintiris)
- Always queue alerts to aclk_alert (#11806, @MrZammler)
- Add some logging for cloud new architecture to access.log (#11788, @MrZammler)
- Delete from aclk alerts table if ack'ed from cloud one day ago (#11779, @MrZammler)
- Remove feature flag for ACLK new cloud architecture (#11774, @stelfrag)
- Insert alert into aclk_alert directly instead of queuing it (#11769, @MrZammler)
- Store and submit dimension delete messages for new cloud architecture (#11765, @stelfrag)
- Implement cloud initiated disconnect command (#11723, @underhood)
- Announce proto capability and enable if cloud supports (#11476, @underhood)
- Add exit points between env and OTP (#11751, @underhood)
- Improve the ACLK sync process for the new cloud architecture (#11744, @stelfrag)
- Disable C++ warnings from dlib library. (#11738, @vkalintiris)
- Add queue removed alerts to cloud for new architecture (#11704, @MrZammler)
- Add support to stream chart labels on a parent - child setup (#11675, @MrZammler)
- Add snapshot message for cloud new architecture (#11664, @MrZammler)
- Add protobuf to
-W buildinfooutput. (#11634, @Ferroin) - Add new alarm status protocol messages (#11612, @underhood)
- Add local webserver API/v1 call "aclk" (#11588, @underhood)
- Make New Cloud architecture optional for ACLK-NG (#11587, @underhood)
- Enable additional functionality for the new cloud architecture (#11579, @stelfrag)
- Add alert message support for ACLK new architecture (#11552, @MrZammler)
- Add support for Anomaly Detection MVP (#11548, @vkalintiris)
- Add New Cloud Protocol files to CMake (#11536, @underhood)
- Add archive uploads for dist, package build, and static build checks. (#11534, @Ferroin)
- Add node message support for ACLK new architecture (#11514, @stelfrag)
- Clean netdata naming (#11484, @andrewm4894)
- Add aclk/cloud state command to netdatacli (#11462, @underhood)
- Add chart message support for ACLK new architecture (#11447, @stelfrag)
- Add Alert Related API for new protocol (#11424, @underhood)
- Update SQLite version from v3.33.0 to 3.36.0 (#11423, @stelfrag)
- Add SQLite unit tests (#11422, @stelfrag)
- Add NodeInstanceInfo API (#11419, @underhood)
- Use SQLite to store the health log and alert configurations. (#11399, @MrZammler)
- Add ACLK synchronization event loop (#11396, @stelfrag)
- Add HTTP basic authentication to Prometheus remote write and HTTP versions of Graphite, JSON, OpenTSDB (#11394, @vlvkobal)
- Add new Cloud chart related parsers and generators (#11393, @underhood)
- Remove warning when GCC 8.x is used (#11389, @thiagoftsm)
- Add support to allow ACLK-NG to grow MQTT buffer (#11340, @underhood)
- Add support for bundled protobuf (#11335, @underhood)
- Add ACLK-NG cloud request type charts (#11326, @UmanShahzad)
- Add HTTP access log messages for ACLK-NG (#11318, @UmanShahzad)
- Add a log message when the page cache manager sleeps for more than 1 second. (#11314, @vkalintiris)
- Add hop count for children (#11311, @stelfrag)
- Remove access check for install-type file (#11288, @MrZammler)
- Support TLS SNI in ACLK-NG (#11285, @underhood)
- Make ACLK-NG the default if available (#11272, @underhood)
- Add extra posthog attributes (#11237, @MrZammler)
- Add support to ACLK-NG for new Cloud NodeInstance related msgs (#11234, @underhood)
- Add support so ACLK NG and Legacy can coexist (#11225, @underhood)
- Move cleanup of obsolete charts to a separate thread (#11222, @vlvkobal)
- Add check to only report the exit code when anonymous statistics script fails (#11215, @MrZammler)
- Reduce memory needed per dimension (#11212, @stelfrag)
- Improve dbengine intialization to ignore journal files that can not be read (#11210, @stelfrag)
- Use memory mode RAM if memory mode dbengine is specified but not available (#11207, @stelfrag)
- Improve return status check for the execution of anonymous statistics script (#11188, @MrZammler)
- Reuse the SN_EXISTS bit to track anomaly status. (#11154, @vkalintiris)
- Remove deprecated command line options (#11149, @vkalintiris)
- Remove unecessary relative paths when including headers. (#11124, @vkalintiris)
- Add field to provide UTC offset in seconds and edit health config command (#11051, @MrZammler)
Bug fixes
- Set NETDATA_CONTAINER_OS_DETECTION properly (#11827, @MrZammler)
- Fix agent crash when ACLK sync thread is not initialized (#11820, @MrZammler)
- Simple fix for the data API query (#11787, @vlvkobal)
- Use the proper format specifier when logging configuration options. (#11795, @vkalintiris)
- Use correct hop count if host is already in memory (#11785, @stelfrag)
- Fix proc/interrupts parser (#11783, @maximethebault)
- Skip sending hidden dimensions via ACLK (#11770, @stelfrag)
- Fix host hop count reported to the cloud (#11768, @stelfrag)
- Fix log if D_ACLK is used (#11763, @underhood)
- Fix retention message duration when no local metrics are found (#11762, @stelfrag)
- Fix an issue with incomplete payload served when https is enabled (#11754, @MrZammler)
- Fix a type in the popocorn information message (#11745, @underhood)
- Fix /api/v1/info if ml-info is missing (#11739, @MrZammler)
- Fix typo in aclk_query.c (#11737, @eltociear)
- Fix online chart in NG not updated properly (#11734, @underhood)
- Fix coverity CID #373610 (#11719, @MrZammler)
- Fix loading old and custom dashboards (#11710, @rupokify)
- Fix coverity issues 373612 & 373611 (#11684, @MrZammler)
- Fix warnings from -Wformat-truncation=2 (#11676, @MrZammler)
- Fix interval usage and reduce I/O (#11662, @thiagoftsm)
- Fix build issue related to legacy aclk and new arch code (#11655, @MrZammler)
- Fix typo in URL when calling env (#11651, @underhood)
- Fix false poll timeout (#11650, @underhood)
- Fix chart config overflow (#11645, @stelfrag)
- Fix an overflow when unsigned integer subtracted (#11638, @vlvkobal)
- Fix coverity issues 373400-373402 (#11631, @stelfrag)
- Fix proper initialization struct with zeroes (#11621, @MrZammler)
- Fix https client (#11608, @underhood)
- Fix CID 339027 and reverse arguments (#11578, @thiagoftsm)
- Fix resource leak when analytics thread stops (#11575, @MrZammler)
- Fix coverity report issues CID_373247-373251 (#11549, @stelfrag)
- Fix coverity issues for health config (#11535, @MrZammler)
- Fix issue with log messages appearing in the terminal instead of the error.log on startup (#11524, @stelfrag)
- Fix issues in Alarm API (#11491, @underhood)
- Fix list corruption in ACLK sync code and remove fatal (#11444, @stelfrag)
- Fix coverity reported issues 372243 - 372248 (#11429, @stelfrag)
- Fix CID 372233 to CID 372236 (#11411, @underhood)
- Fix bundled protobuf linkage on systems needing -latomic (#11406, @underhood)
- Fix coverity issue 372222 (#11404, @stelfrag)
- Fix typo in analytics.c (#11329, @eltociear)
- Fix coverity errors in ACLK (#11322, @underhood)
- Fix confusing error in ACLK Legacy (#11278, @underhood)
- Fix an issue to send correct aclk implementation used by agent to posthog. (#11247, @MrZammler)
- Fix error on --disable-cloud (#11244, @underhood)
- Fix mqtt_websockets submodule version (#11196, @underhood)
- Fix claiming script exit code when daemon not running and the claim was successful (#11195, @ilyam8)
- Fix loading of class, component and type from health log when sufficient fields are detected. (#11193, @MrZammler)
- Fix issue with mqtt_websockets on FreeBSD (#11172, @underhood)
- Fix typo in aclk.c (#11170, @eltociear)
- Fix mqtt_websockets on MacOS (#11145, @underhood)
Deprecation notice
An upcoming stable release of the Netdata agent will include a maintainability update to our base Docker image.
A small percentage of users will find that all self-compiled packages must be manually rebuilt after the update, even if relocation/SONAME errors are not encountered. --security-opt=seccomp=unconfined can be passed with no default.json, but this introduces security vulnerabilities between the host and malicious code in the container.
Alternatively, users can prepare for the update by upgrading to one of the following:
- runc v1.0.0-rc93
- Docker 19.03.9 or greater AND libseccomp 2.4.2 or greater
While Netdata previously avoided making this update to minimize inconvenience to our users, we are now facing a third-party end-of-life date, and we believe the minimal number of affected users substantiates the need for the change.
Additionally, in a future stable release, we will be removing our legacy agent-to-cloud connection. Most users should see no change in this upgrade, but we will lose SOCKS 5 proxy support for the Netdata Cloud functionality, which will affect a small number of users.
Support options
As we grow, we stay committed to providing the best support ever seen from an open-source solution. Should you encounter an issue with any of the changes made in this release or any feature in the Netdata agent, feel free to contact us by one of the following channels:
- Github: You can use our Github repo to report bugs and submit feature requests
- Community forum: You can visit our community forum for questions and training.
- NEW: Discord: You can jump into our Discord for interactive, synchronous help and discussion. More than 700 engineers are already using it! Join us!
Published by netdatabot over 3 years ago
The v1.31.0 release of Netdata comes with re-packaged and redesigned elements of the dashboard to help you focus on your metrics, even more Linux kernel insights via eBPF, on-node machine learning to help you find anomalies, and much more.
This release contains 10 new collectors, 54 improvements (7 in the dashboard), 31 documentation updates, and 29 bug fixes.
At a glance
We re-packaged and redesigned portions of the dashboard to improve the overall experience. Part of this effort is better handling of dashboard code during installation—anyone using third-party packages (such as the Netdata Homebrew formula) will start seeing new features and the new designs starting today. The timeframe picker has moved to the top panel, and just to its right are two counters with live CRITICAL and WARNING alarm statuses for your node. Click on either of these two open the alarms modal.
We've also pushed a number of powerful new collectors, including directory cache monitoring via eBPF. By monitoring directory cache, developers and SREs alike can find opportunities to optimize memory usage and reduce disk-intensive operations.
Our new Z-scores and changefinder collectors use machine learning to let you know, at a glance, when key metrics start to behave oddly. We'd love to get feedback on these sophisticated, subjective new brand of collectors!
Netdata Learn, our documentation and educational site, got some refreshed visuals and an improved navigation tree to help you find the right doc quickly. Hit Ctrl/⌘ + k to start a new search!
Update now
If you're not receiving automatic updates on your node(s), check our update doc for details.
Acknowledgments
- @jsoref for fixing numerous spelling mistakes.
- @Steve8291 for improving plugins error logging on restart and documentation improvement.
- @vincentkersten for updating the nvidia-smi collector documentation.
- @Avre for updating the install on cloud providers doc.
- @endreszabo for adding renaming libvirtd LXC containers support.
-
@RaitoBezarius for adding attribute 249 support to the
smartd_logmodule. -
@Habetdin for updating the
fpingversion. -
@wangpei-nice for fixing
.deband.rpmpackaging of the eBPF plugin. - @tiramiseb for improving the installation method for Alpine.
- @BastienBalaud for upgrading the OKay repository for RHEL8.
- @tknobi for adding the Nextcloud plugin to the third-party collector list.
- @jilleJr for adding IPv6 listen address example to the Nginx proxy doc.
- @cherouvim for formatting and wording in the Apache proxy doc.
- @yavin87 for fixing spelling in the infrastructure monitoring quickstart.
-
@tnyeanderson for improving
dash-example.html. - @tomcbe for fixing Microsoft Teams notification method naming.
-
@tnyeanderson For improving the
dash-exampledocumentation. - @diizzyy for fixing a bug in the FreeBSD plugin.
Improvements
- Automatically trigger Helmchart PR on Agent release. (#11084, @Ferroin)
- Implement ACLK env endpoint. (#10833, @underhood)
- Implement new HTTPS client for ACLK. (#10805, @underhood)
- Update ACLK passwd endpoint to match specifications of the new architecture. (#10859, @underhood)
- Implement ACLK new backoff (TBEB) architecture. (#10941, @underhood)
- Add functionality to store
node_idfor a host. (#11059, @stelfrag) - Remove version negotiation from ACLK-NG .(#10980, @underhood)
- Persist claim IDs in local database for parent and children. (#10993, @stelfrag)
- Provide more agent analytics to PostHog. (#11020, @MrZammler)
- Reduce logging when sending agent analytics. (#11091, @MrZammler)
- Remove error message on Netdata restart. (#8685, @Steve8291)
- Add a timeout when sending anonymous statistics using
curl. (#11010, @ilyam8) - Improve
dash-example.html. (#10870, @tnyeanderson) - Add
host_cloud_enabledattribute to analytics. (#11100, @MrZammler)
Dashboard
- Bundle the react dashboard code into the agent repo directly. (#11139, @Ferroin)
- Add dashboard info strings for
systemdunitscollector. (#10904, @ilyam8) - Update dashboard version to v2.17.0. (#10856, @allelos)
- Top bar, side panel and overall navigation has been redesigned.
- Top bar now includes a light bulb icon with news/features and the number of
CRITICALorWARNINGalarms. - Documentation and settings buttons moved to the sidebar.
- Improved rendering of sign in/sign up option button along with an operational status option (under user settings).
- In the left panel, nodes show a status badge and are now searchable if there are more than 4.
Health
Improvements
- Add
chartsconfiguration option to templates. (#11054, @thiagoftsm) - Add new attributes to health configuration files. (#10961, @MrZammler)
- Add
inconsistentstate to themysql_galera_cluster_statealarm. (#10945, @ilyam8) - Add systemdunits collector alarms. (#10906, @ilyam8)
- Use
averageinstead ofsumin VerneMQ alarms. (#11037, @ilyam8) - Check configuration for
CUSTOMandMSTEAM. (#11113, @MrZammler) - Reduce alarms notifications dump logging. (#11116, @ilyam8)
Bug fixes
- Add
synchronization.confto the Makefile. (#10907, @ilyam8) - Fix Microsoft Teams naming. (#9905, @tomcbe)
Collectors
New
- Add a chart for out of memory kills. (#10880, @vlvkobal)
- Add a chart with Netdata uptime. (#10997, @vlvkobal)
- Add a module for ZFS pool state. (#11071, @vlvkobal)
- Add a plugin for the system clock synchronization state. (#10895, @vlvkobal)
- Add new charts for extended disk metrics. (#10939, @vlvkobal)
- Add support for renaming libvirtd LXC containers. (#11006, @endreszabo)
- Add a metric for Percpu memory. (#10964, @vlvkobal)
- Add an eBPF directory cache collector. (#10855, @thiagoftsm)
- Add a Z-scores python collector. (#10673, @andrewm4894)
- Add changefinder python collector. (#10672, @andrewm4894)
Improvements
- Remove dots in cgroup IDs. (#11050, @vlvkobal)
- Add support for attribute 249 (NAND Writes 1GiB) to the
smartd_logmodule. (#10872, @RaitoBezarius) - Add RAID level to the
mdstatcollector chart families. (#11024, @ilyam8) - Update
fpingversion. (#10977, @Habetdin) - Add plugin and module names to the
python.d.pluginruntime charts. (#11007, @ilyam8) - Move global stats to a separate thread .(#10991, @vlvkobal)
- Add memory size adjustments for eBPF hash tables. (#10962, @thiagoftsm)
- Add improvements to anomalies collector. (#11003, @andrewm4894)
- Add support for loading of
kprobenames in the eBPF plugin. (#11034, @thiagoftsm) - Don't repeat the
cgroupdiscovery cleanup info message. (#11101, @vlvkobal) - Change ACLK statistics charts units from kB/s to KiB/s. (#11103, @ilyam8)
Bug fixes
- Use
size_tinstead of int forvfs_bufspace_countin FreeBSD plugin. (#11142, @diizzyy) - Fix the detection of cgroups v2 by checking the version of the default cgroup mountpoint. (#11102, @vlvkobal)
- Fix eBPF cachestat chart type. (#11074, @thiagoftsm)
- Fix gaps in eBPF cachestat charts. (#10972, @thiagoftsm)
- Fix detection of
opensipsctlexecutable. (#10978, @ilyam8) - Fix network interfaces detection when using
virsh. (#11096, @ilyam8) - Fix eBPF plugin crash during shutdown. (#10957, @thiagoftsm)
Exporting
Improvements
Bug fixes
Packaging and installation
- Fix
.deband.rpmpackaging of the eBPF plugin. (#11031, @wangpei-nice) - Upgrade OKay repository for RHEL8. (#10973, @BastienBalaud)
- Support mulitple jobs in
make(1)when building LWS. (#10799, @vkalintiris) - Build
mqtt_websocketswith Netdata autotools. (#11083, @underhood)
Documentation
- Improve dashboard documentation (part 3). (#11099, @joelhans)
- Fix broken link in dimensions/contexts/families doc. (#11148, @joelhans)
- Add info on other memory modes to
performance.md. (#11144, @cakrit) - Remove dash-example, place in community repo. (#11077, @tnyeanderson)
- Update
k6.md. (#11127, @OdysLam) - Fix broken links in various docs. (#11109, @joelhans)
- Fix broken link in doc. (#11122, @forest0)
- Add third-party collector: Nextcloud plugin. (#11032, @tknobi)
- Add IPv6 listen address example to the Nginx proxy doc. (#10473, @jilleJr)
- Add documentation for claiming during kickstart installation. (#11052, @joelhans)
- Add lists of monitored metrics to the
cgroupsplugin documentation. (#10924, @vlvkobal) - Adds --recursive to Git clones. (#10932, @underhood)
- Fix formatting and wording in the Apache proxy doc. (#8706, @cherouvim)
- Fix spelling in the infrastructure monitoring doc. (#11082, @yavin87)
- Improve dashboard documentation (part 1). (#11015, @joelhans)
- Improve dashboard documentation (part 2). (#11065, @joelhans)
- Improve get started/installation docs. (#10995, @joelhans)
- Improve installation method for Alpine. (#11035, @tiramiseb)
- Improve StatsD+K6 documentation. (#10985, @OdysLam)
- Overhaul streaming documentation. (#10709, @joelhans)
- Remove RewriteEngine for dedicated vHost. (#10873, @Steve8291)
- Remove links to old install doc. (#11014, @joelhans)
- Remove outdated privacy policy and terms of use. (#10979, @joelhans)
- Replace references to Google Analytics with Posthog where relevant. (#10868, @andrewm4894)
- Fix a typo in the cloud providers installation doc. (#10942, @Avre)
- Update eBPF documentation with new eBPF configuration filename and directory. (#10982, @thiagoftsm)
- Update web server options for respecting browser DNT. (#10157, @joelhans)
- Fix spelling in StatsD guide. (#10975, @OdysLam)
- Clarify which health configuration entities are required. (#11086, @ilyam8)
- Fix alarm line
optionssyntax in the docs. (#10974, @ilyam8) - Update the
nvidia-smicollector documentation. (#10214, @vincentkersten)
Bug fixes
- Reduce the number of ACLK chart updates during chart obsoletion. (#11133, @stelfrag)
- Fix SSL random failures when using multithreaded web server with OpenSSL <
1.1.0. (#11089, @thiagoftsm) - Fix storing an
NULLclaim ID on a parent node. (#11036, @stelfrag) - Prevent MQTT connection attempt on OTP failure. (#10839, @underhood)
- Rename struct fields from class to classification. (#11019, @vkalintiris)
- Fix spelling mistakes in various components:
- aclk (#10910, @jsoref)
- build (#10909, @jsoref)
- collectors (#10912, @jsoref)
- daemon (#10913, @jsoref)
- database (#10914, @jsoref)
- exporting (#10915, @jsoref)
- libnetdata (#10917, @jsoref)
- health (#10916, @jsoref)
- streaming (#10919, @jsoref)
- tests (#10920, @jsoref)
- backend (#10911, @jsoref)
- bidirectional (#10918, @jsoref)
- HTTP API (#10921, @jsoref)
- web (#10922, @jsoref)
Published by netdatabot over 3 years ago
This is a patch release to address discovered issues since 1.30.0.
Acknowledgments
- @jsoref for fixing numerous spelling mistakes.
Documentation
- Fix grammar in ACLK README.md. (#10898, @slimanio)
- Update news and GIF in README, fix typo. (#10900, @joelhans)
- Fix spelling mistakes in various places. (#10428, @jsoref)
Packaging / Installation
- Don’t use glob expansion in argument to
cdin updater. (#10936, @Ferroin) - Bumped version of OpenSSL bundled in static builds to 1.1.1k. (#10884, @Ferroin)
- Fix bundling of ACLK-NG components in dist tarballs. (#10894, @Ferroin)
Bug Fixes
Published by netdatabot over 3 years ago
The v1.30.0 release of Netdata brings major improvements to our packaging and completely replaces Google Analytics/GTM for product telemetry. We're also releasing the first changes in an upcoming overhaul to both our dashboard UI/UX and the suite of preconfigured alarms that comes with every installation.
v1.30.0 contains 3 new collectors, 3 enhancements to notifications method, 38 improvements (13 in the dashboard), 16 documentation updates, and 17 bug fixes.
At a glance
The ACLK-NG is a much faster method of securely connecting a node to Netdata Cloud. In addition, there are no external dependencies to our custom libmosquitto and libwebsockets libraries, which means there's no more need to build these during installation. To enable ACLK-NG on a node that's already running the Netdata Agent, reinstall with the --aclk-ng option:
bash <(curl -Ss https://my-netdata.io/kickstart.sh) --aclk-ng --reinstall
We replaced Google Analytics/GTM, which we used for collecting product telemetry, with a self-hosted instance of the open-source PostHog project. When sending statistics to PostHog, any fields that might contain identifiable information, such as an IP address or URL, are hardcoded. If you previously opted-out of anonymous statistics, this migration does not change your existing settings.
We also published a developer environment (devenv) to simplify contributing to the Netdata Agent. The devenv packages everything you need to develop improvements on the Netdata Agent itself, or its collectors, in a single Docker image. Read more about this devenv, and get started, in the Netdata community repo.
Acknowledgments
- @aazedo for adding collection of attribute 233 (Media Wearout Indicator (SSD)) to the smartd_log collector
- @ossimantylahti for fixing a typo in the email notifications readme
- @KickerTom for renaming abs to ABS to avoid clash with standard definitions
- @Steve8291 for improving email, cron and ups groups in the apps_group.conf
- @liepumartins for adding wireguard to the vpn group in the apps_group.conf
- @eltociear for fixing typos in main.h, backend_prometheus.c and dashboard_info.js
- @Habetdin for fixing broken external links in the WEB GUI
- @salazarp for updating the syntax for Caddy v2
- @RaitoBezarius for adding support to change IRC_PORT
Improvements
- Support VS Code container devenv. (#10723, @OdysLam)
- Add check for children connecting to a parent agent with an unsupported memory mode. (#10787, @stelfrag)
- Add lock check to avoid shutdown when compiled with internal and locking checks. (#10835, @stelfrag)
- Update chart's metadata in database when it already exists during creation. (#10728, @stelfrag)
- ACLK separate HTTPS client. (#10784, @underhood)
- Add new ACLK implementation (
ACLK-NG). (#10315, @underhood) - Add CPU statistics per ALCK query thread. (#10634, @MrZammler)
- Add
_aclk_impllabel to the/api/v1/infoendpoint. (#10778, @underhood) - Add a new
chartparameter to the/api/v1/alarm_logendpoint. (#10788, @MrZammler) - Add data query support for archived charts. (#10771, @stelfrag)
- Add HTTP cookie (SameSite, Secure). (#10676, @thiagoftsm)
- Add statistics per Cloud query type. (#10602, @underhood)
- Add support for changing the number of pages per database engine extent. (#10593, @mfundul)
- Add the ability to store chart labels in the database. (#10718, @stelfrag)
- Enable metadata persistence in all memory modes. (#10742, @stelfrag)
- Increase
curl connect-timeoutand decrease number of claim attempts. (#10800, @ilyam8) - Increase the ACLK exponential backoff randomness. (#10373, @underhood)
- Log ACLK Cloud commands to
access.log. (#10697, @stelfrag) - Remove an unused function warning in legacy version of the ACLK. (#10731, @underhood)
- Remove unreachable #else directives in plugins. (#10523, @vkalintiris)
- Rename
struct avltoavl_elementand thetypedeftoavl_t. (#10735, @vkalintiris) - Replace Google Analytics with PostHog for backend telemetry events. (#10636, @andrewm4894)
- Skip C++ incompatible header in main libnetdata header. (#10737, @vkalintiris)
- Try to keep all pages from extents read from disk in the cache. (#10558, @mfundul)
- Use a parameter name that is not a reserved keyword in C++. (#10738, @vkalintiris)
- Use of out-of-line struct definitions. (#10739, @vkalintiris)
Dashboard
- Add
maxvalue to thenvidia_smi.fan_speedgauge. (#10780, @ilyam8) - Add state map to duplex and operstate charts. (#10752, @vlvkobal)
- Add supervisord to
dashboard_info.js. (#10754, @ilyam8) - Fix broken external links. (#10586, @Habetdin)
- Make network state map syntax consistent in
dashboard_info.js. (#10849, @ilyam8) - [email protected] (#10761, @jacekkolasa)
- Fix alarms log export.
- Persist relative timeframe.
- Allow multirow names in the replicated nodes list.
- Fix the date & time picker overlap.
- Update Font Awesome.
- Truncate long names.
- Update links: change
docs.netdata.cloudto learn.netdata.cloud. - Remove Google's GA & GTM completely, in favor of open-source PostHog.
Health
Bug fixes
- Fix delaying CLEAR notifications when using the
repeatfeature. (#10846, @thiagoftsm) - Fix wrong count of entries in the
alarm.log. (#10564, @thiagoftsm)
Alarms
- Add
wmi_prefix to the wmi collector network alarms. (#10782, @ilyam8) - Add collector prefix to the external collectors alarms. (#10830, @ilyam8)
- Apply adapter_raid alarms for every logical/physical device. (#10820, @ilyam8)
- Apply megacli alarms for every adapter/physical disk. (#10834, @ilyam8)
- Exclude cgroups network interfaces from packets dropped alarms. (#10806, @ilyam8)
- Fix various alarms critical and warning thresholds hysteresis. (#10779, @ilyam8)
- Improve alarms
infofields. (#10853, @ilyam8) - Make VerneMQ alarms less sensitive. (#10770, @ilyam8)
- Make alarms less sensitive. (#10688, @ilyam8)
- Remove
exporting_metrics_losttemplate. (#10829, @ilyam8) - Remove
ram_in_swapalarm. (#10789, @ilyam8) - Use separate
packets_dropped_ratioalarms for wireless network interfaces. (#10785, @ilyam8)
Notifications
- Add ability to change port number when using IRC notification method. (#10824, @RaitoBezarius)
- Add
dump_methodsparameter toalarm-notify.sh.in. (#10772, @MrZammler) - Log an error if there is a failure during an email alarm notification. (#10818, @ilyam8)
Collectors
New
- Add monitoring of synchronization system calls to the eBPF collector. (#10814, @thiagoftsm)
- Add monitoring of Linux page cache to the eBPF collector. (#10693, @thiagoftsm)
Improvements
- Add
k6.confto the StatsD collector. (#10733, @OdysLam) - Clean up the eBPF collector. (#10680, @thiagoftsm)
- Use working set for memory utilization in the cgroups collector. (#10712, @vlvkobal)
- Add new configuration parameters to the example Python collector. (#10777, @andrewm4894)
- Add carrier and MTU charts for network interfaces. (#10866, @vlvkobal)
- Improve email, cron, and UPS groups in the
apps.pluginconfiguration. (#9313, @Steve8291) - Add Wireguard to the
vpngroup in theapps.pluginconfiguration. (#10743, @liepumartins) - Add alarm values collection to the Python alarms collector. (#10675, @andrewm4894)
- Add
attribute 233(Media Wearout Indicator (SSD)) collection to the python smartd_log collector. (#10711, @aazedo) - Move network interface speed, duplex, and operstate variables to charts. (#10740, @vlvkobal)
- Update
go.d.pluginversion to v0.28.1. (#10826, @ilyam8) - Add a
noauthcodecheckworkaround flag to the freeipmi collector. (#10701, @vlvkobal)
Bug fixes
- Fix eBPF collector compatibility with kernels v5.11+. (#10707, @thiagoftsm)
- Fix disks identification in the diskstats collector. (#10843, @vlvkobal)
- Fix the count of
cpuset.cpusin the cgroups collector. (#10757, @ilyam8) - Fix disk utilization and backlog charts in the diskstats collector. (#10705, @vlvkobal)
Exporting
Bug fixes
Packaging and installation
- Add JSON output option for
buildinfo. (#10706, @Ferroin) - Add information about the
--aclk-ngoption to the netdata-installer script. (#10852, @underhood) - Add support for claiming nodes as part of installation. (#10084, @Ferroin)
- Assorted updater fixes (#10613, @Ferroin)
- Fix claiming via environment variables in a Docker container (#10811, @ilyam8)
- Fix detection of already claimed node in Docker images (#10720, @Ferroin)
- Fix handling of perf.plugin capabilities (#10766, @Ferroin)
- Fix handling of permissions for some plugins (#10490, @Ferroin)
Documentation
- Add guide: Develop a custom data collector for Netdata in Python. (#10710, @joelhans)
- Add guide: LAMP stack monitoring. (#10698, @joelhans)
- Add guide: Unsupervised anomaly detection for Raspberry Pi monitoring. (#10713, @joelhans)
- Add guide: How to use any StatsD data source with Netdata. (#10719, @OdysLam)
- Convert references to
servicetosystemctl. (#10703, @joelhans) - Fix broken link in StatsD guide. (#10831, @joelhans)
- Fix broken links in active alarms doc. (#10678, @joelhans)
- Improve the Kubernetes deployment documentation. (#10662, @joelhans)
- Revamp StatsD docs. (#10637, @OdysLam)
- Update guide: Kubernetes monitoring with Netdata: Overview and visualizations. (#10691, @joelhans)
- Update screenshots and text for new Cloud navigation. (#10664, @joelhans)
- Comment out
memory modemention in StatsD example. (#10751, @OdysLam) - Fix a typo in the email notifications doc. (#10668, @ossimantylahti)
- Update syntax for Caddy v2. (#10823, @salazarp)
Bug fixes
- Fix a typo in
main.h. (#10858, @eltociear) - Fix a typo in
backend_prometheus.c. (#10716, @eltociear) - Fix a typo in
dashboard_info.js. (#10775, @eltociear) - Fix segfault due to misalignment between global and StatsD memory modes. (#10732, @stelfrag)
- Fix zombie alarms for charts that are obsolete/removed. (#10804, @vlvkobal)
- Fix a Coverity warning in the new MQTT library. (#10851, @underhood)
- Fix a parameter binding issue when storing chart names in the database. (#10717, @stelfrag)
- Fix crash when executing data query with context and non-existing
chart_label_key. (#10844, @stelfrag) - Fix claiming behind Squid proxy. (#10734, @underhood)
- Fix Coverity issue (CID 367566). (#10813, @stelfrag)
- Fix memory leak when archived data is requested. (#10837, @stelfrag)
- Fix clash with C++ standard definitions by changing
abstoABS. (#10354, @KickerTom)