
chartify
Python library that makes it easy for data scientists to create charts.
APACHE-2.0 License
Chartify
|status| |release| |python| |CI|
.. |status| image:: https://img.shields.io/badge/Status-Beta-blue.svg .. |release| image:: https://img.shields.io/badge/Release-4.0.3-blue.svg .. |python| image:: https://img.shields.io/badge/Python-3.7-blue.svg .. |CI| image:: https://github.com/spotify/chartify/workflows/Tox/badge.svg :target: https://github.com/spotify/chartify/actions
Chartify is a Python library that makes it easy for data scientists to create charts.
Why use Chartify?
- Consistent input data format: Spend less time transforming data to get your charts to work. All plotting functions use a consistent tidy input data format.
- Smart default styles: Create pretty charts with very little customization required.
- Simple API: We've attempted to make the API as intuitive and easy to learn as possible.
- Flexibility: Chartify is built on top of
Bokeh <http://bokeh.pydata.org/en/latest/>_, so if you do need more control you can always fall back on Bokeh's API.
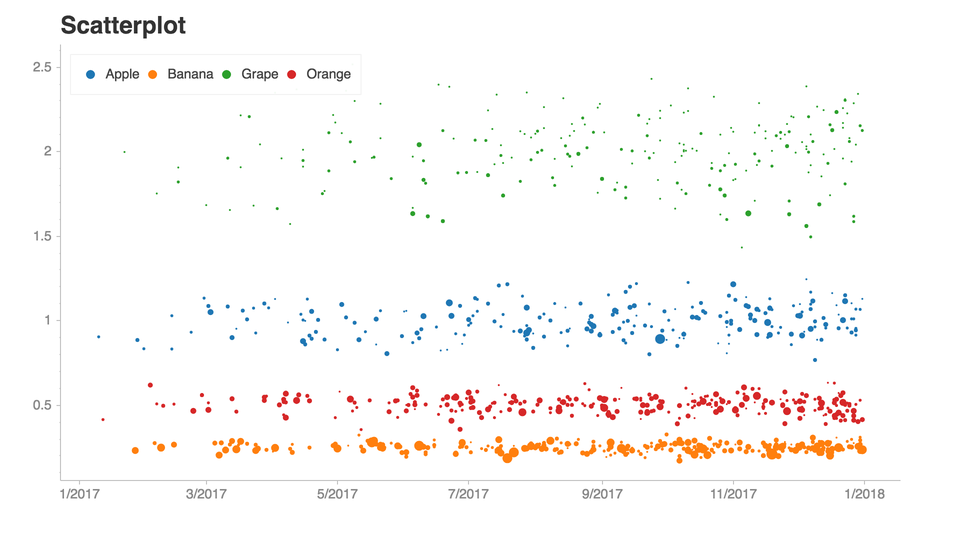
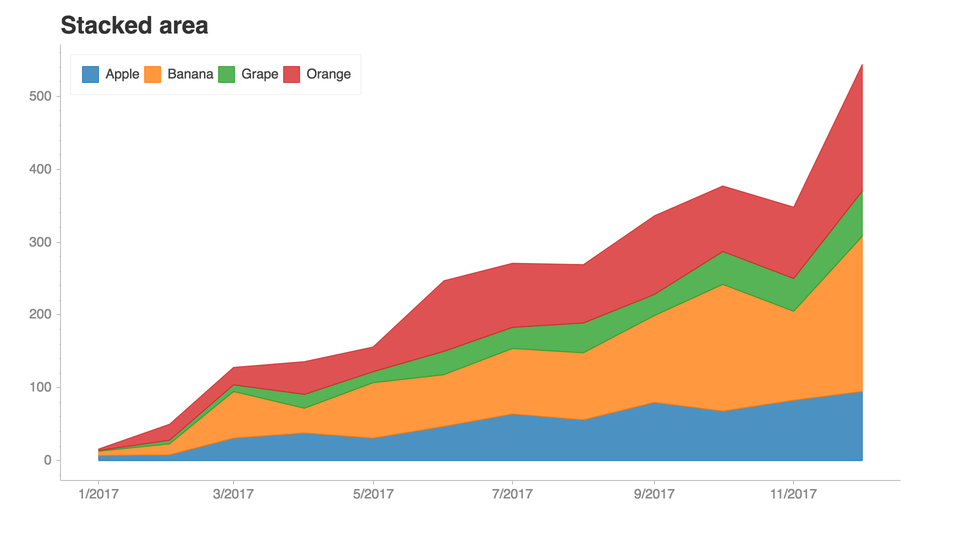
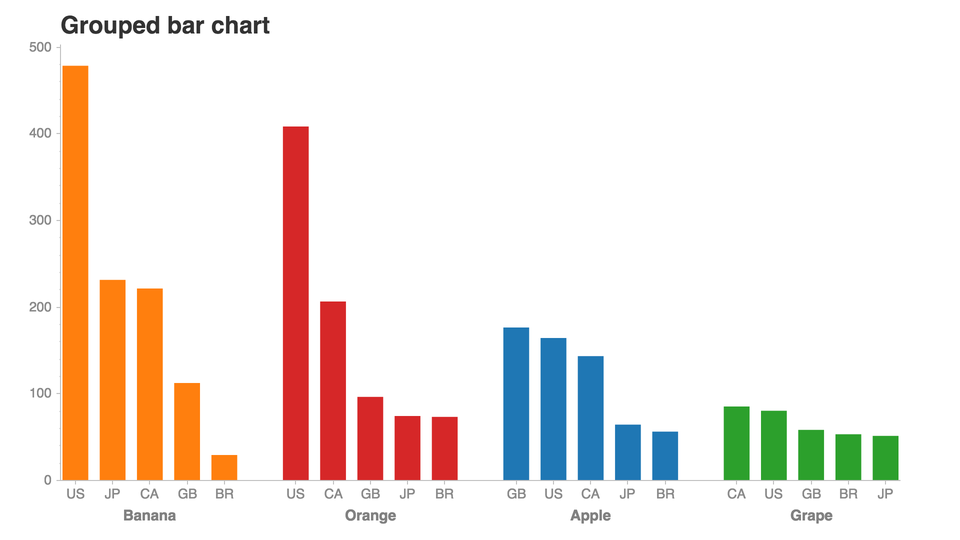
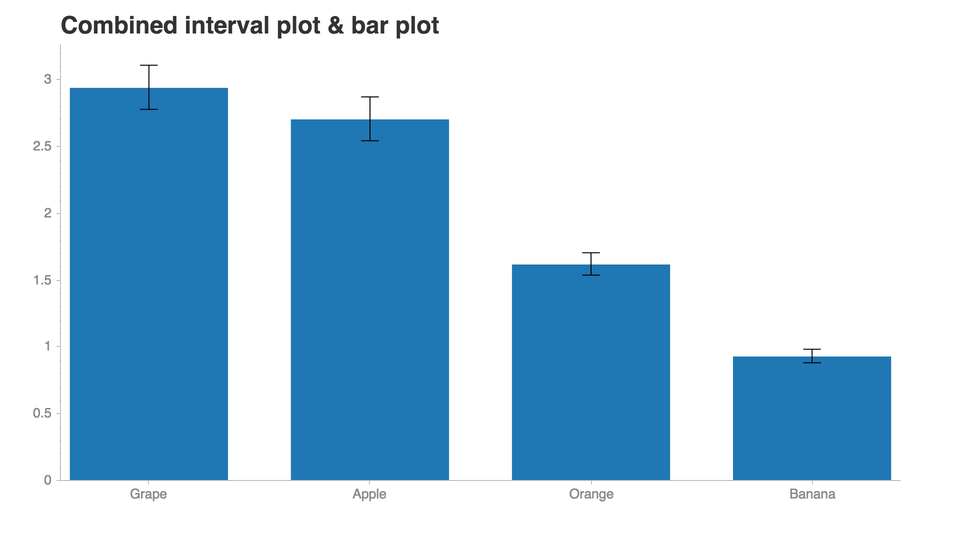
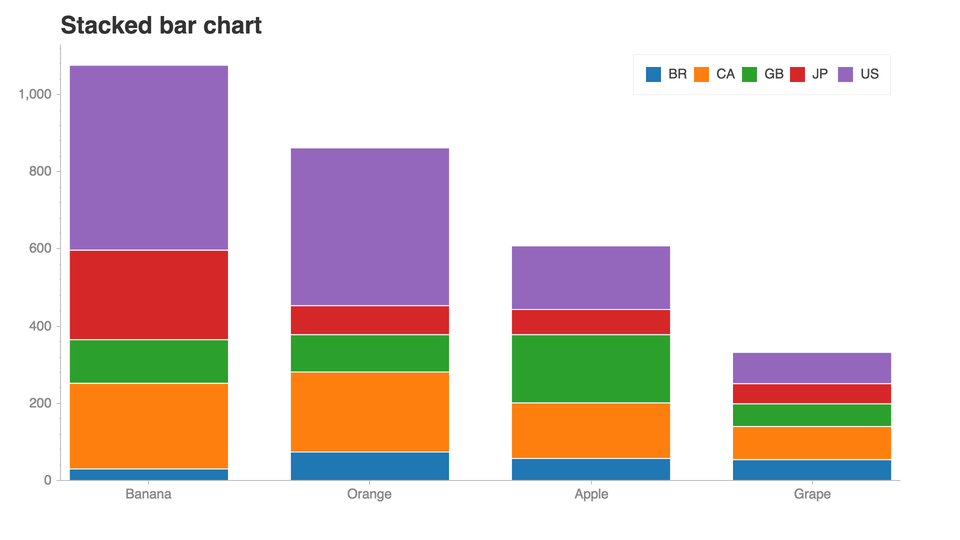
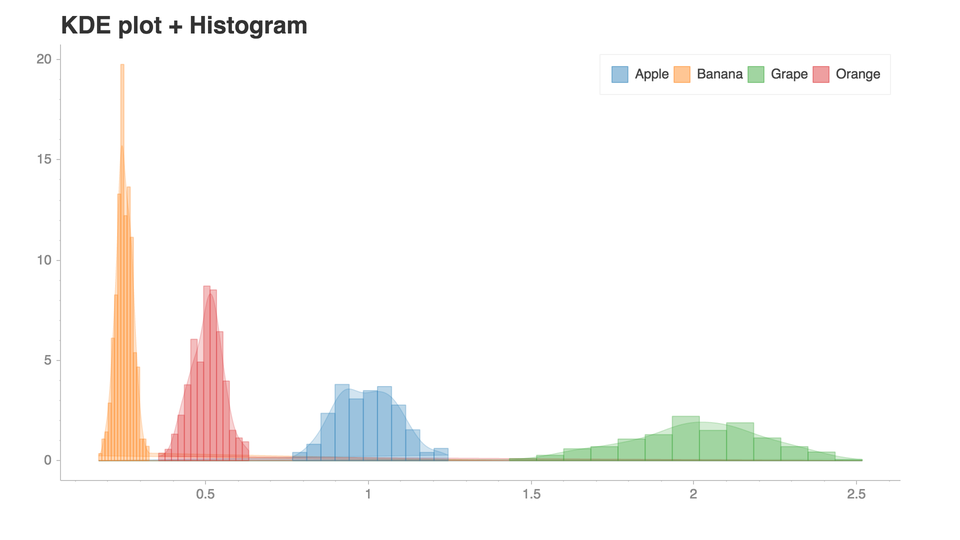
Examples
.. image:: https://raw.githubusercontent.com/spotify/chartify/master/docs/_static/chartify1.png .. image:: https://raw.githubusercontent.com/spotify/chartify/master/docs/_static/chartify2.png .. image:: https://raw.githubusercontent.com/spotify/chartify/master/docs/_static/chartify3.png .. image:: https://raw.githubusercontent.com/spotify/chartify/master/docs/_static/chartify4.png .. image:: https://raw.githubusercontent.com/spotify/chartify/master/docs/_static/chartify5.png .. image:: https://raw.githubusercontent.com/spotify/chartify/master/docs/_static/chartify6.png
See this notebook for more examples! </examples/Examples.ipynb>_.
Installation
- Chartify can be installed via pip:
pip3 install chartify
- Install chromedriver requirement (Optional. Needed for PNG output):
- Install google chrome.
- Download the appropriate version of chromedriver for your OS
here <https://sites.google.com/chromium.org/driver/>_. - Copy the executable file to a directory within your PATH.
- View directorys in your PATH variable:
echo $PATH - Copy chromedriver to the appropriate directory, e.g.:
cp chromedriver /usr/local/bin
Getting started
This tutorial notebook <https://github.com/spotify/chartify/blob/master/examples/Chartify%20Tutorial.ipynb>_ is the best place to get started with a guided tour of the core concepts of Chartify.
From there, check out the example notebook <https://github.com/spotify/chartify/blob/master/examples/Examples.ipynb>_ for a list of all the available plots.
Docs
Documentation available on chartify.readthedocs.io <https://chartify.readthedocs.io/en/latest/>_
Getting support
Join #chartify on spotify-foss.slack.com (Get an invite <https://slackin.spotify.com/>_)
Use the chartify tag on StackOverflow <https://stackoverflow.com/questions/tagged/chartify>_.
Resources
- Data Visualization with
Chartify <https://www.section.io/engineering-education/data-viz-chartify/>_
Code of Conduct
This project adheres to the Open Code of Conduct <https://github.com/spotify/code-of-conduct/blob/master/code-of-conduct.md>_. By participating, you are expected to honor this code.
Contributing
See the contributing docs <https://github.com/spotify/chartify/blob/master/CONTRIBUTING.rst>_.