datacube-2nd-order-stats
2nd-order robust temporal statistics of Earth observations
APACHE-2.0 License
2nd-Order Robust Temporal Statistics of Earth Observations
This datacube-stats plug-in generates outputs to robustly understand variation in the landscape.
The core concept of our approach is to extend the classic concept of median absolute deviation to the multidimensional case by replacing the absolute value in the definition by a vector distance. There are many possible choices for vector distances and we choose three that are structurally different. These are the cosine distance, the Euclidean distance, and the Bray-Curtis distance.
Example Outputs
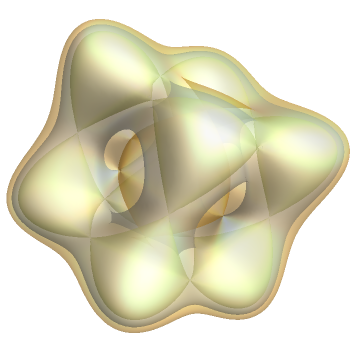
The TernaryMAD 3-band output demonstrates a rainbow opal-like coloring of a cropping area which means the 3 bands are uncorrelated (a highly desirable property).
Visualising the BrayCurtisDistanceMAD over the Menindee lakes, Australia.
Temporal Statistics
The following temporal statistics models are available:
-
CosineDistanceMAD(orSMAD) generates a single-band output where the cosine distance MAD is computed through time for every pixel. -
EuclideanDistanceMAD(orEMAD) generates a single-band output where the Euclidean distance MAD is computed through time for every pixel. -
BrayCurtisDistanceMAD(orBCMAD) generates a single-band output where the Bray-Curtis distance MAD is computed through time for every pixel. -
TernaryMADgenerates a 3-band output where the cosine distance MAD (Band 1), the Euclidean distance MAD (Band 2), the Bray-Curtis distance MAD (Band 3) is computed through time for every pixel. For this output, the distances are transformed by -log(x).
Installation
git clone https://github.com/daleroberts/datacube-2nd-order-stats
Continental-scale or large area
Some additional tools are contained in this repository:
-
job.pbsis a PBS job script that reads thetilesfile (tiles specified in Australian Albers) and parallelises across multiple nodes. -
retileis a python script (used byjob.pbs) that reads theconfig.yamland generates a new tiling number scheme fordatacube-statsthat is based on thetile_sizeparameter inconfig.yaml. -
statis a python script that gives information about how many of the output tiles have been generated so far. It is useful for checking the status of continental runs.
Testing
The unittests for the package can be found in model/test_.py. You can use pytest in the root of the repository to run them.
References
-
Roberts, D., Dunn, B., & Mueller, N. (2018, July). Open Data Cube Products Using High-Dimensional Statistics of Time Series. IEEE International Geoscience and Remote Sensing Symposium 2018. 8647-8650.
-
Roberts, D., Mueller, N., & Mcintyre, A. (2017). High-dimensional pixel composites from earth observation time series. IEEE Transactions on Geoscience and Remote Sensing, 55(11), 6254-6264.